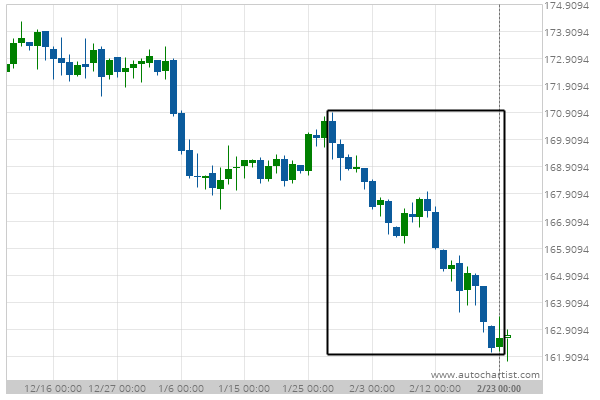
US T-Bond excessive bearish movement Posted on February 24, 2021 by Autochartist wrote in Futures Statistical Analysis - TD. US T-Bond experienced a 4.23% bearish movement in the last 26 days. Tags: Big Movement, ZB 0 Likes 495 Views You may also like Soybeans excessive bearish movement September 3, 2020 Soybeans excessive bearish movement July 22, 2020 Live Cattle excessive bearish movement September 19, 2018 Comments are closed.