Help & Documentation
  • Home
  • Sign In
  • Contact Us
  • Home
  • Sign In
  • Contact Us

US T-Bond excessive bearish movement

/Futures Statistical Analysis - TD/US T-Bond excessive bearish movement

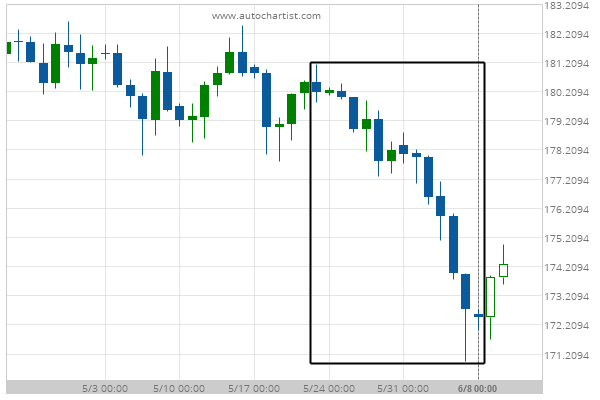
US T-Bond excessive bearish movement

Posted on June 10, 2020 by Autochartist wrote in Futures Statistical Analysis - TD.

US T-Bond experienced a 4.28% bearish movement in the last 17 days.

Tags: Big Movement, ZB
0 Likes
557 Views

You may also like

Lean Hogs excessive bearish movement
April 27, 2020
Soybean Meal excessive bearish movement
May 28, 2019
Silver Front Month excessive bearish movement
December 16, 2020

Comments are closed.

USD/CHF down to 0.9480 E-mini S&P 500 excessive bearish movement

Futures Statistical Analysis – TD

Soybean Oil excessive bearish movement

March 9, 2021 11:16 am | By Autochartist

Soybean Oil experienced a 19.04% bullish movement in the last... Read more →

Corn excessive bearish movement

March 8, 2021 11:19 am | By Autochartist

Corn experienced a 4.61% bullish movement in the last 73... Read more →

Gold Front Month excessive bearish movement

March 8, 2021 11:19 am | By Autochartist

Gold Front Month experienced a 6.29% bearish movement in the... Read more →

Light Sweet Crude Oil Front Month excessive bearish movement

March 8, 2021 11:19 am | By Autochartist

Light Sweet Crude Oil Front Month experienced a 8.6% bullish... Read more →

10 year T-Note excessive bearish movement

March 8, 2021 11:19 am | By Autochartist

10 year T-Note experienced a 3.4% bearish movement in the... Read more →

  • About Us
  • Privacy Policy
  • Disclaimer
  • Terms and Conditions
  • Get started for FREE
  • Contact Us
Copyright © 2022 Autochartist.com. All rights reserved.
This site uses cookies: Find out more.