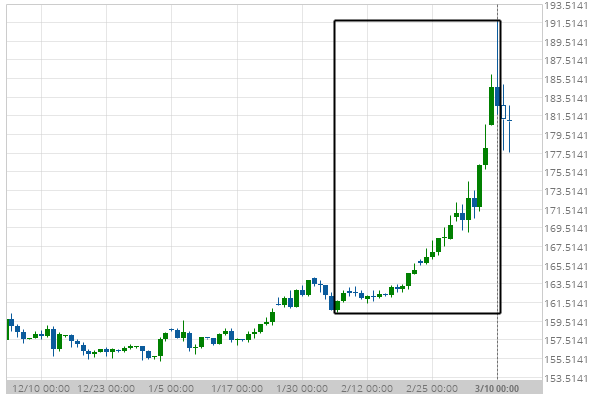
US T-Bond excessive bearish movement Posted on March 12, 2020 by Autochartist wrote in Futures Statistical Analysis - TD. US T-Bond experienced a 12.91% bullish movement in the last 32 days. Tags: Big Movement, ZB 0 Likes 808 Views You may also like Light Sweet Crude Oil Front Month excessive bearish movement March 1, 2021 Silver Front Month excessive bearish movement November 22, 2018 E-mini S&P 500 excessive bullish movement April 9, 2020 Comments are closed.