Help & Documentation
  • Home
  • Sign In
  • Contact Us
  • Home
  • Sign In
  • Contact Us

US T-Bond down to 181.0000

/Futures Technical Analysis - TD/US T-Bond down to 181.0000

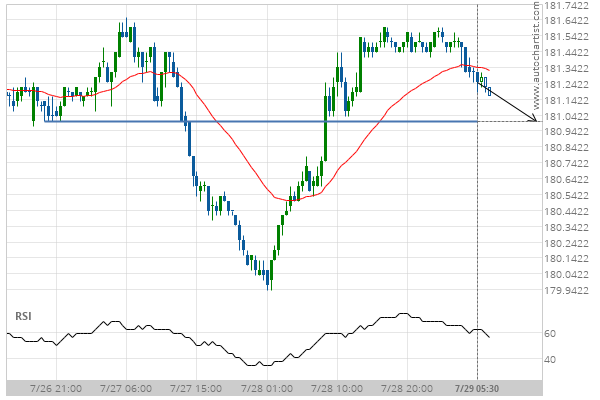
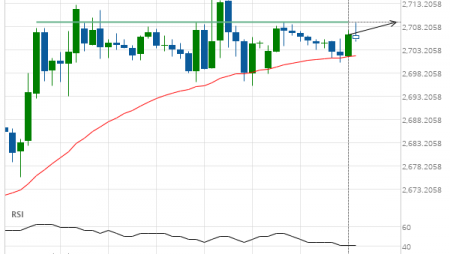
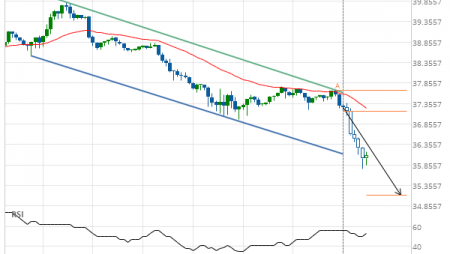
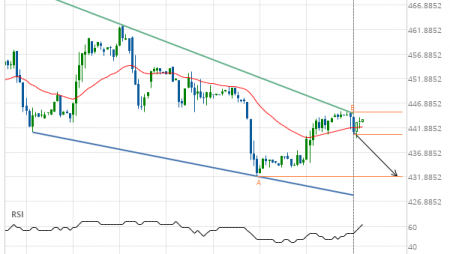
US T-Bond down to 181.0000

Posted on July 29, 2020 by Autochartist wrote in Futures Technical Analysis - TD.

Approaching Support level of 181.0000 identified at 29-Jul-2020 05:30 EDT

Tags: ZB
0 Likes
606 Views

You may also like

Corn up to 569.4500
Corn up to 569.4500
February 23, 2021
KC HRW Wheat up to 455.0000
August 27, 2020
Soybean Oil down to 30.9600
August 20, 2020

Comments are closed.

Silver Front Month down to 22.0097 E-mini S&P 500 down to 3191.5000

Futures Technical Analysis – TD

Light Sweet Crude Oil Front Month up to 67.9800

March 9, 2021 11:17 am | By Autochartist

Rising Wedge identified at 09-Mar-2021 05:00 EST. This pattern is... Read more →

Feeder Cattle Front Month down to 137.2250

March 9, 2021 11:17 am | By Autochartist

Channel Down identified at 08-Mar-2021 14:00 EST. This pattern is... Read more →

Soybean Oil up to 53.2300

March 9, 2021 11:17 am | By Autochartist

Channel Up identified at 09-Mar-2021 04:30 EST. This pattern is... Read more →

Silver Front Month up to 26.5600

March 9, 2021 11:17 am | By Autochartist

Approaching Resistance level of 26.5600 identified at 09-Mar-2021 04:00 EST Read more →

10 year T-Note up to 133.1644

March 9, 2021 11:17 am | By Autochartist

Falling Wedge has broken through the resistance line at 09-Mar-2021... Read more →

  • About Us
  • Privacy Policy
  • Disclaimer
  • Terms and Conditions
  • Get started for FREE
  • Contact Us
Copyright © 2022 Autochartist.com. All rights reserved.
This site uses cookies: Find out more.