Help & Documentation
  • Home
  • Sign In
  • Contact Us
  • Home
  • Sign In
  • Contact Us

US T-Bond down to 174.5469

/Futures Technical Analysis - TD/US T-Bond down to 174.5469

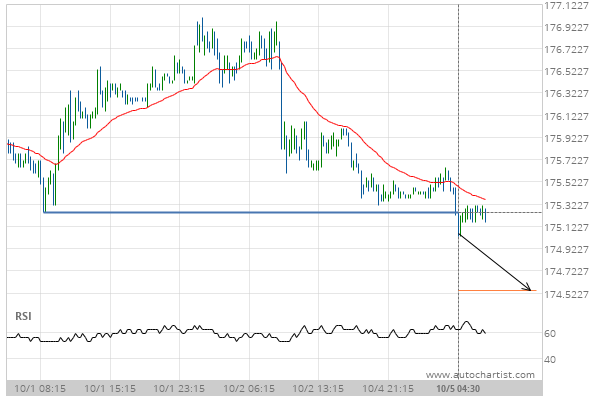
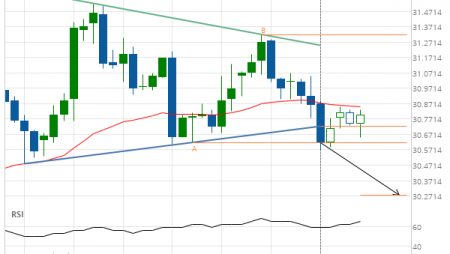
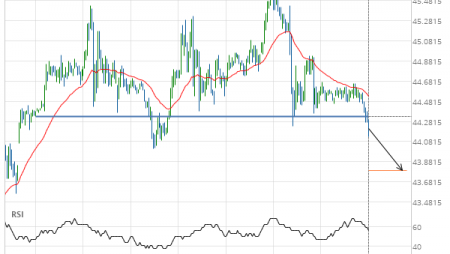
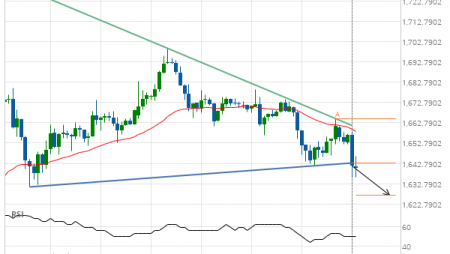
US T-Bond down to 174.5469

Posted on October 5, 2020 by Autochartist wrote in Futures Technical Analysis - TD.

Broke through Support level of 175.2500 at 05-Oct-2020 04:30 EDT

Tags: ZB
0 Likes
413 Views

You may also like

US T-Bond up to 145.9375
January 30, 2019
Soybean Meal up to 294.7000
April 17, 2020
Silver Front Month down to 14.8550
April 15, 2019

Comments are closed.

Feeder Cattle Front Month excessive bearish movement Gold Front Month up to 1911.5000

Futures Technical Analysis – TD

Light Sweet Crude Oil Front Month up to 67.9800

March 9, 2021 11:17 am | By Autochartist

Rising Wedge identified at 09-Mar-2021 05:00 EST. This pattern is... Read more →

Feeder Cattle Front Month down to 137.2250

March 9, 2021 11:17 am | By Autochartist

Channel Down identified at 08-Mar-2021 14:00 EST. This pattern is... Read more →

Soybean Oil up to 53.2300

March 9, 2021 11:17 am | By Autochartist

Channel Up identified at 09-Mar-2021 04:30 EST. This pattern is... Read more →

Silver Front Month up to 26.5600

March 9, 2021 11:17 am | By Autochartist

Approaching Resistance level of 26.5600 identified at 09-Mar-2021 04:00 EST Read more →

10 year T-Note up to 133.1644

March 9, 2021 11:17 am | By Autochartist

Falling Wedge has broken through the resistance line at 09-Mar-2021... Read more →

  • About Us
  • Privacy Policy
  • Disclaimer
  • Terms and Conditions
  • Get started for FREE
  • Contact Us
Copyright © 2022 Autochartist.com. All rights reserved.
This site uses cookies: Find out more.