Help & Documentation
  • Home
  • Sign In
  • Contact Us
  • Home
  • Sign In
  • Contact Us

US T-Bond down to 173.2312

/Futures Technical Analysis - TD/US T-Bond down to 173.2312

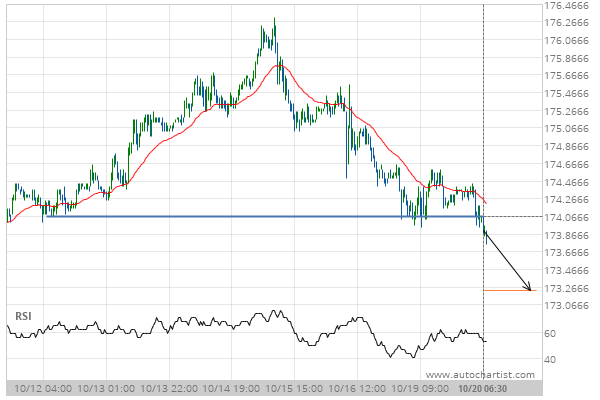
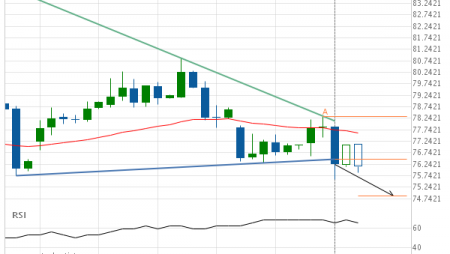
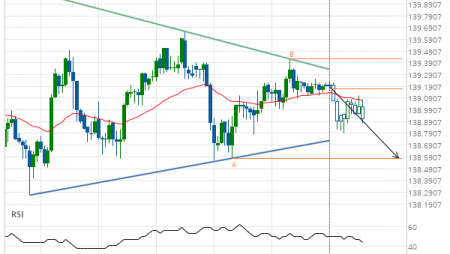
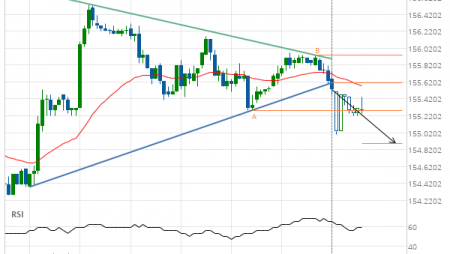
US T-Bond down to 173.2312

Posted on October 20, 2020 by Autochartist wrote in Futures Technical Analysis - TD.

Broke through Support level of 174.0625 at 20-Oct-2020 06:30 EDT

Tags: ZB
0 Likes
389 Views

You may also like

Silver Front Month up to 15.9469
February 18, 2019
Light Sweet Crude Oil Front Month down to 35.8165
June 9, 2020
Gold Front Month up to 1581.7000
February 14, 2020

Comments are closed.

10 year T-Note down to 138.7188 Gold Front Month down to 1885.0000

Futures Technical Analysis – TD

Light Sweet Crude Oil Front Month up to 67.9800

March 9, 2021 11:17 am | By Autochartist

Rising Wedge identified at 09-Mar-2021 05:00 EST. This pattern is... Read more →

Feeder Cattle Front Month down to 137.2250

March 9, 2021 11:17 am | By Autochartist

Channel Down identified at 08-Mar-2021 14:00 EST. This pattern is... Read more →

Soybean Oil up to 53.2300

March 9, 2021 11:17 am | By Autochartist

Channel Up identified at 09-Mar-2021 04:30 EST. This pattern is... Read more →

Silver Front Month up to 26.5600

March 9, 2021 11:17 am | By Autochartist

Approaching Resistance level of 26.5600 identified at 09-Mar-2021 04:00 EST Read more →

10 year T-Note up to 133.1644

March 9, 2021 11:17 am | By Autochartist

Falling Wedge has broken through the resistance line at 09-Mar-2021... Read more →

  • About Us
  • Privacy Policy
  • Disclaimer
  • Terms and Conditions
  • Get started for FREE
  • Contact Us
Copyright © 2022 Autochartist.com. All rights reserved.
This site uses cookies: Find out more.