Help & Documentation
  • Home
  • Sign In
  • Contact Us
  • Home
  • Sign In
  • Contact Us

US T-Bond down to 164.6875

/Futures Technical Analysis - TD/US T-Bond down to 164.6875

US T-Bond down to 164.6875

Posted on February 16, 2021 by Autochartist wrote in Futures Technical Analysis - TD.

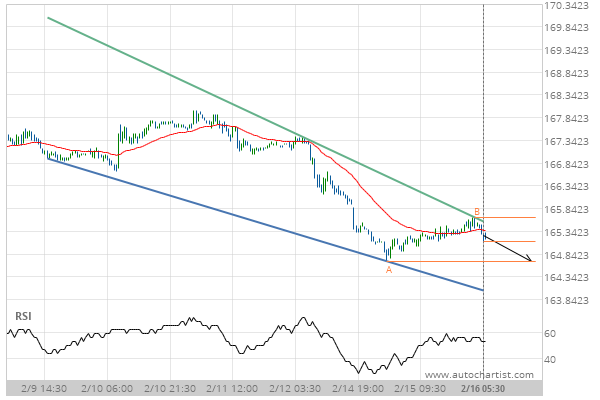
Falling Wedge identified at 16-Feb-2021 05:30 EST. This pattern is still in the process of forming. Possible bearish price movement towards the support 164.6875 within the next day.

Tags: CBOT-GBX, ZB
0 Likes
324 Views

You may also like

Corn up to 385.1500
Corn up to 385.1500
December 13, 2019
Corn up to 366.8250
Corn up to 366.8250
September 8, 2020
10 year T-Note down to 121.8906
February 18, 2019

Comments are closed.

10 year T-Note down to 136.0625 Light Sweet Crude Oil Front Month down to 57.4100

Futures Technical Analysis – TD

Light Sweet Crude Oil Front Month up to 67.9800

March 9, 2021 11:17 am | By Autochartist

Rising Wedge identified at 09-Mar-2021 05:00 EST. This pattern is... Read more →

Feeder Cattle Front Month down to 137.2250

March 9, 2021 11:17 am | By Autochartist

Channel Down identified at 08-Mar-2021 14:00 EST. This pattern is... Read more →

Soybean Oil up to 53.2300

March 9, 2021 11:17 am | By Autochartist

Channel Up identified at 09-Mar-2021 04:30 EST. This pattern is... Read more →

Silver Front Month up to 26.5600

March 9, 2021 11:17 am | By Autochartist

Approaching Resistance level of 26.5600 identified at 09-Mar-2021 04:00 EST Read more →

10 year T-Note up to 133.1644

March 9, 2021 11:17 am | By Autochartist

Falling Wedge has broken through the resistance line at 09-Mar-2021... Read more →

  • About Us
  • Privacy Policy
  • Disclaimer
  • Terms and Conditions
  • Get started for FREE
  • Contact Us
Copyright © 2022 Autochartist.com. All rights reserved.
This site uses cookies: Find out more.