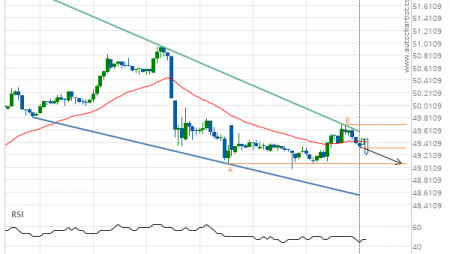
US T-Bond down to 161.8442
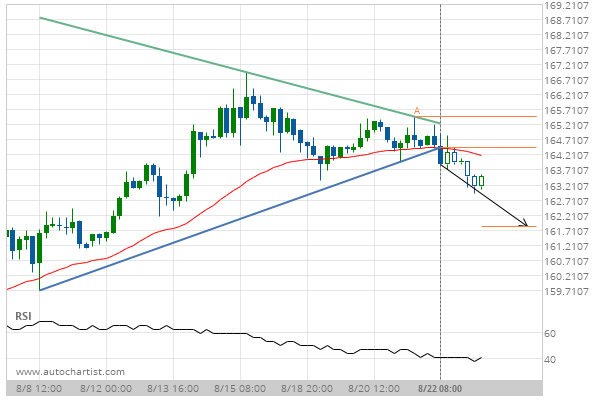
Triangle has broken through the support line at 22-Aug-2019 08:00 EDT. Possible bearish price movement forecast for the next 2 days towards 161.8442.
Triangle has broken through the support line at 22-Aug-2019 08:00 EDT. Possible bearish price movement forecast for the next 2 days towards 161.8442.