Help & Documentation
  • Home
  • Sign In
  • Contact Us
  • Home
  • Sign In
  • Contact Us

US T-Bond down to 158.7544

/Futures Technical Analysis - TD/US T-Bond down to 158.7544

US T-Bond down to 158.7544

Posted on October 17, 2019 by Autochartist wrote in Futures Technical Analysis - TD.

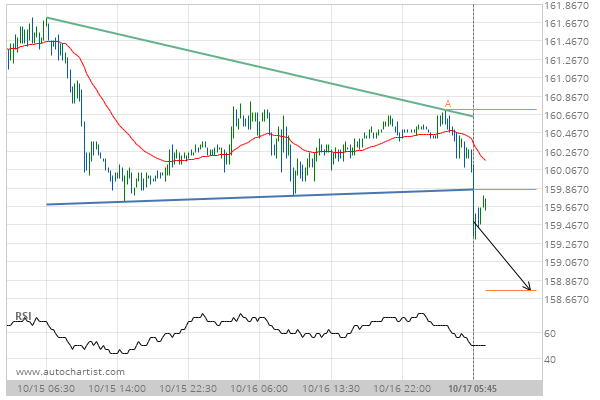
Descending Triangle has broken through the support line at 17-Oct-2019 05:45 EDT. Possible bearish price movement forecast for the next 14 hours towards 158.7544.

Tags: CBOT, ZB
0 Likes
569 Views

You may also like

Gold Front Month up to 1312.0000
April 11, 2019
Silver Front Month up to 18.1100
May 29, 2020
Gold Front Month up to 1911.5000
October 5, 2020

Comments are closed.

Feeder Cattle Front Month down to 140.5250 10 year T-Note down to 128.8968

Futures Technical Analysis – TD

Light Sweet Crude Oil Front Month up to 67.9800

March 9, 2021 11:17 am | By Autochartist

Rising Wedge identified at 09-Mar-2021 05:00 EST. This pattern is... Read more →

Feeder Cattle Front Month down to 137.2250

March 9, 2021 11:17 am | By Autochartist

Channel Down identified at 08-Mar-2021 14:00 EST. This pattern is... Read more →

Soybean Oil up to 53.2300

March 9, 2021 11:17 am | By Autochartist

Channel Up identified at 09-Mar-2021 04:30 EST. This pattern is... Read more →

Silver Front Month up to 26.5600

March 9, 2021 11:17 am | By Autochartist

Approaching Resistance level of 26.5600 identified at 09-Mar-2021 04:00 EST Read more →

10 year T-Note up to 133.1644

March 9, 2021 11:17 am | By Autochartist

Falling Wedge has broken through the resistance line at 09-Mar-2021... Read more →

  • About Us
  • Privacy Policy
  • Disclaimer
  • Terms and Conditions
  • Get started for FREE
  • Contact Us
Copyright © 2020 Autochartist.com. All rights reserved.
This site uses cookies: Find out more.