Help & Documentation
  • Home
  • Sign In
  • Contact Us
  • Home
  • Sign In
  • Contact Us

US T-Bond down to 154.8961

/Futures Technical Analysis - TD/US T-Bond down to 154.8961

US T-Bond down to 154.8961

Posted on June 21, 2019 by Autochartist wrote in Futures Technical Analysis - TD.

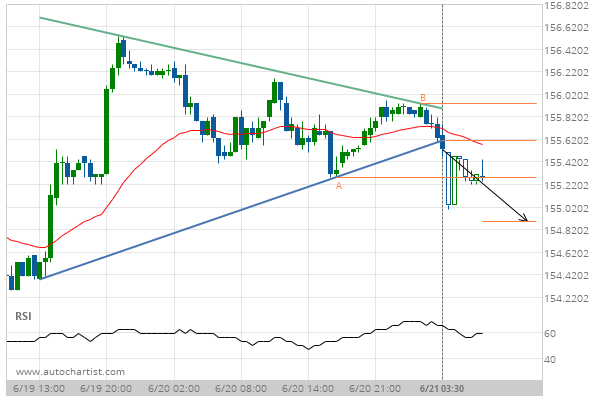
Triangle has broken through the support line at 21-Jun-2019 03:30 EDT. Possible bearish price movement forecast for the next 8 hours towards 154.8961.

Tags: CBOT, ZB
0 Likes
841 Views

You may also like

Lean Hogs up to 79.8250
July 2, 2019
Gold Front Month down to 1598.8195
March 31, 2020
E-mini S&P 500 down to 2956.1873
October 24, 2019

Comments are closed.

10 year T-Note down to 127.0938 E-mini S&P 500 up to 2963.2500

Futures Technical Analysis – TD

Light Sweet Crude Oil Front Month up to 67.9800

March 9, 2021 11:17 am | By Autochartist

Rising Wedge identified at 09-Mar-2021 05:00 EST. This pattern is... Read more →

Feeder Cattle Front Month down to 137.2250

March 9, 2021 11:17 am | By Autochartist

Channel Down identified at 08-Mar-2021 14:00 EST. This pattern is... Read more →

Soybean Oil up to 53.2300

March 9, 2021 11:17 am | By Autochartist

Channel Up identified at 09-Mar-2021 04:30 EST. This pattern is... Read more →

Silver Front Month up to 26.5600

March 9, 2021 11:17 am | By Autochartist

Approaching Resistance level of 26.5600 identified at 09-Mar-2021 04:00 EST Read more →

10 year T-Note up to 133.1644

March 9, 2021 11:17 am | By Autochartist

Falling Wedge has broken through the resistance line at 09-Mar-2021... Read more →

  • About Us
  • Privacy Policy
  • Disclaimer
  • Terms and Conditions
  • Get started for FREE
  • Contact Us
Copyright © 2022 Autochartist.com. All rights reserved.
This site uses cookies: Find out more.