Help & Documentation
  • Home
  • Sign In
  • Contact Us
  • Home
  • Sign In
  • Contact Us

US T-Bond down to 153.5344

/Futures Technical Analysis - TD/US T-Bond down to 153.5344

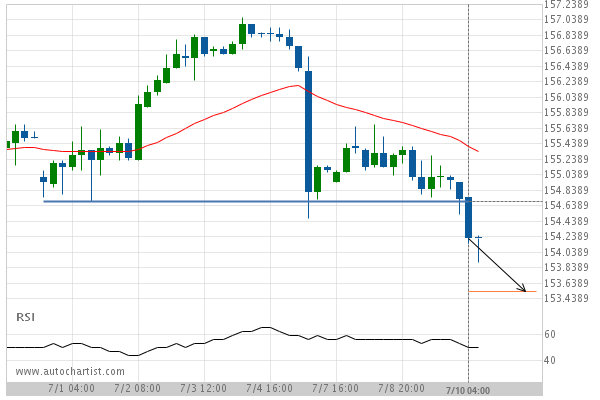
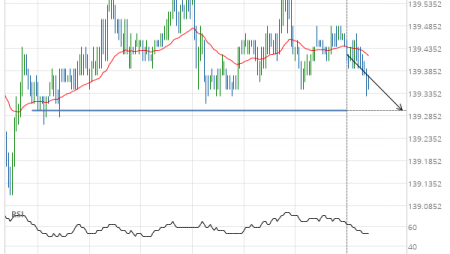
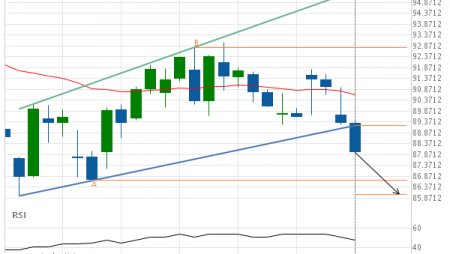
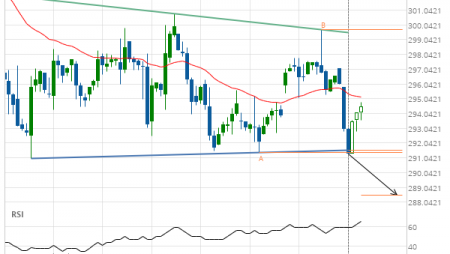
US T-Bond down to 153.5344

Posted on July 10, 2019 by Autochartist wrote in Futures Technical Analysis - TD.

Broke through Support level of 154.6875 at 10-Jul-2019 04:00 EDT

Tags: ZB
0 Likes
775 Views

You may also like

Silver Front Month down to 15.6400
February 11, 2019
Silver Front Month down to 15.0463
April 11, 2019
US T-Bond down to 181.2813
August 5, 2020

Comments are closed.

Trade of the Day: GBP/AUD Silver Front Month up to 15.1988

Futures Technical Analysis – TD

Light Sweet Crude Oil Front Month up to 67.9800

March 9, 2021 11:17 am | By Autochartist

Rising Wedge identified at 09-Mar-2021 05:00 EST. This pattern is... Read more →

Feeder Cattle Front Month down to 137.2250

March 9, 2021 11:17 am | By Autochartist

Channel Down identified at 08-Mar-2021 14:00 EST. This pattern is... Read more →

Soybean Oil up to 53.2300

March 9, 2021 11:17 am | By Autochartist

Channel Up identified at 09-Mar-2021 04:30 EST. This pattern is... Read more →

Silver Front Month up to 26.5600

March 9, 2021 11:17 am | By Autochartist

Approaching Resistance level of 26.5600 identified at 09-Mar-2021 04:00 EST Read more →

10 year T-Note up to 133.1644

March 9, 2021 11:17 am | By Autochartist

Falling Wedge has broken through the resistance line at 09-Mar-2021... Read more →

  • About Us
  • Privacy Policy
  • Disclaimer
  • Terms and Conditions
  • Get started for FREE
  • Contact Us
Copyright © 2022 Autochartist.com. All rights reserved.
This site uses cookies: Find out more.