Trade of the Day: USD/JPY
By: Dima Chernovolov
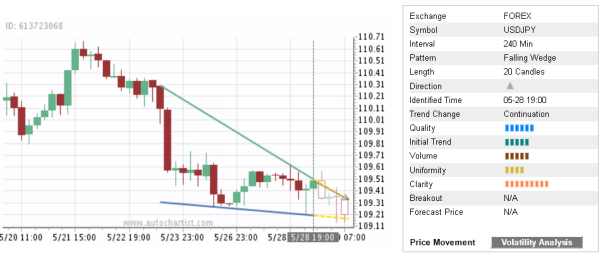
USD/JPY continues to rise inside the 4-hour Falling Wedge chart pattern which was previously identified by Autochartist. Autochartist rates the quality of this Falling Wedge at the 6-bar level – which is the result of the medium Initial Trend (5 bars), lower Uniformity (4 bars) and near-maximum Clarity (9 bars). USD/JPY is expected to rise further inside this Falling Wedge – in line with the earlier upward reversal from the support area highlighted below.
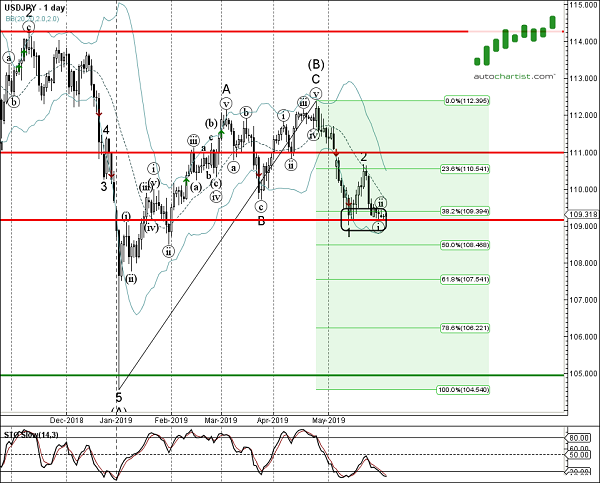
As can be seen from the daily USD/JPY chart below, the price earlier reversed up from the support area lying between the key support level 109.15 (which also reversed the price at the start of May), lower daily Bollinger Band and the 38.2% Fibonacci correction of the previous upward impulse from January. The proximity of this support area and the oversold daily Stochastic increase the probability USD/JPY will continue to rise inside this Falling Wedge.