Trade of the Day: USD/JPY
By: Dima Chernovolov
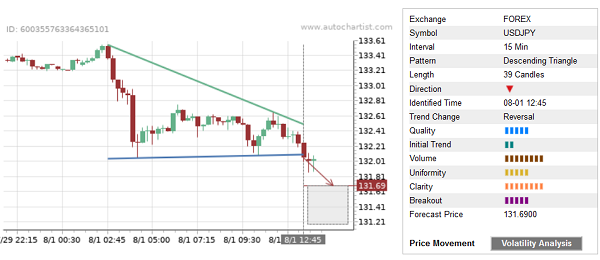
USD/JPY recently broke the 15-minute Descending Triangle chart pattern, which was recently identified by Autochartist. Autochartist rated the quality of this Descending Triangle at the 5-bar level – which reflects the slow Initial Trend (2 bars), medium Uniformity (5 bars) and higher Clarity (8 bars). USD/JPY is expected to fall toward the forecast price 131.69.
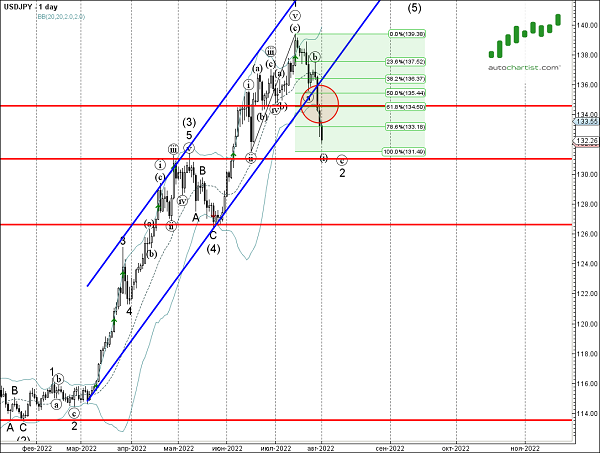
As can be seen from the daily USD/JPY chart below – the pair earlier broke the support area lying between the support level 134.60, support channel from March and the 61.8% Fibonacci correction of the upward impulse from July. This price area is acting as the resistance area after it was broken. The proximity of this resistance zone adds to the probability USD/JPY will continue to fall toward the forecast price 131.69.