Trade of the Day: USD/JPY
By: Dima Chernovolov
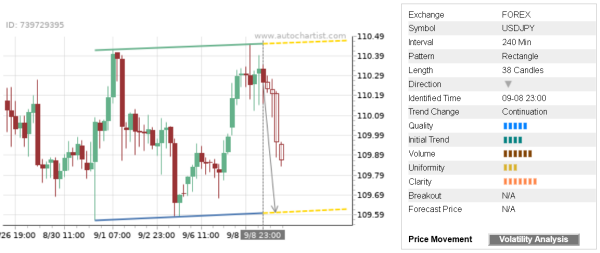
USD/JPY continues to fall inside the 4-hour Rectangle chart pattern, which was recently identified by Autochartist. Autochartist rates the quality of this Rectangle at the 5-bar level – which is the result of the slow Initial Trend (4 bars), lower Uniformity (3 bars) and significant Clarity (7 bars). USD/JPY is expected to continue to fall inside this Rectangle.
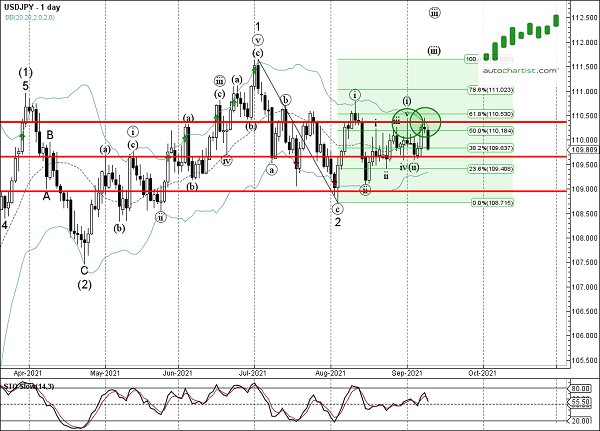
As can be seen from the daily USD/JPY chart below – the price recently reversed down from the resistance area located between the resistance level 110.35 (which has been reversing the pair form last July), upper daily Bollinger Band and the 61.8% Fibonacci correction of the previous ABC correction from July. The proximity of this resistance area increases the probability USD/JPY will continue to fall inside this Rectangle.