Торговля дня: USD / JPY
От: Dima Chernovolov
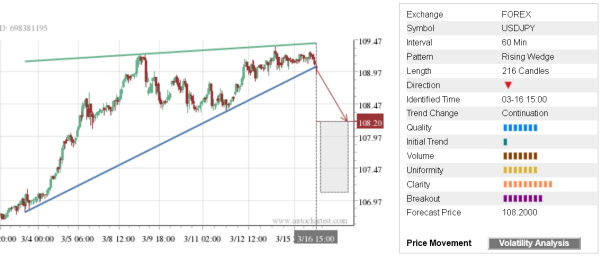
USD/JPY recently broke the hourly Rising Wedge chart pattern which was previously identified by Autochartist. Autochartist оценивает качество восходящего клина на уровне 7 столбцов, что является результатом медленного начального тренда. (1 бар), значительная Однородность (8 брусья) и максимальная Ясность (10 брусья). USD / JPY, как ожидается, упадет к прогнозируемой цене 108.20 – in line with the earlier downward reversal from the resistance area show below.
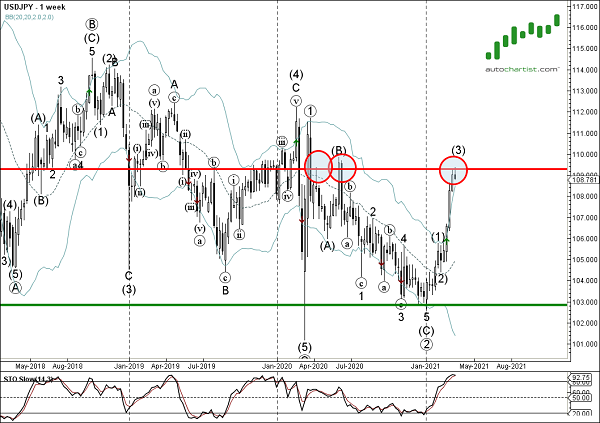
As can be seen from the weekly USD/JPY chart below – the price earlier reversed down from the resistance area located between the key resistance level 109.30 (which has been reversing the pair from the start of 2020) и верхняя полоса Боллинджера еженедельно. The proximity of this resistance zone and the overbought weekly Stochastic increase the probability USD/JPY will continue to fall toward the forecast price 108.20.