Trade of the Day: USD/JPY
By: Dima Chernovolov
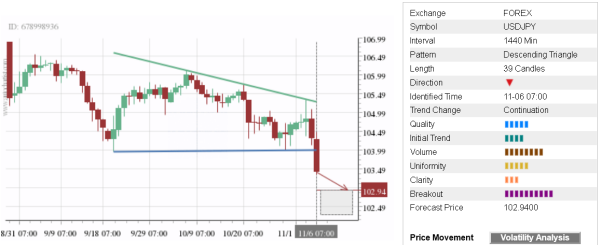
USD/JPY recently broke the daily Descending Triangle chart pattern, which was recently identified by Autochartist. Autochartist rates the quality of this Descending Triangle at the 5-bar level – which is the result of the below-average Initial Trend (4 bars), medium Uniformity (5 bars) and lower Clarity (3 bars). USD/JPY is expected to fall toward the forecast price 102.94.
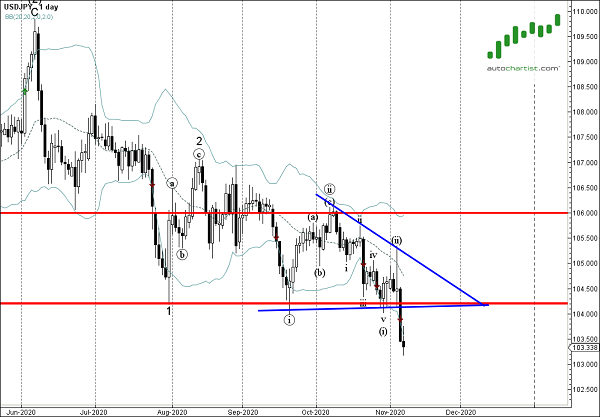
As can be seen from the USD/JPY chart below, the breakout of this Descending Triangle coincided with the breakout of the key support 104.197 (which has been steadily reversing the price from July). This price level is acting as the resistance level after it was broken. The proximity of this resistance level increases the probability USD/JPY will continue to fall toward the forecast price 102.94.