Trade of the Day: USD/JPY
By: Dima Chernovolov
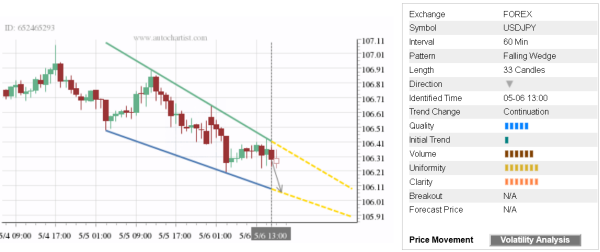
USD/JPY continues to fall inside the hourly Falling Wedge chart pattern which was recently identified by Autochartist. Autochartist rates the quality of this Falling Wedge at the 5-bar level – which is the result of the slow Initial Trend (1 bar) and significant Uniformity and Clarity (both rated at the 7 bar level). USD/JPY is expected to fall further inside this chart pattern – in line with the earlier breakout of the support area shown below.
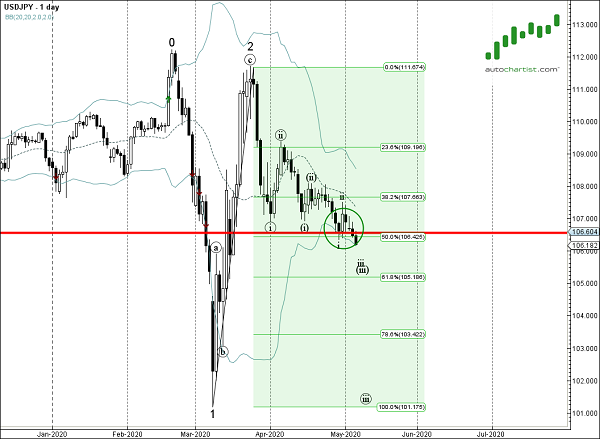
As can be seen from the daily USD/JPY chart below – the pair recently broke the support area lying between the key support level 106.60 (which stopped the previous downward impulse in April) and the 50% Fibonacci correction of the earlier sharp upward price correction from March. This price zone is acting as the resistance area after it was broken. The proximity of this resistance area increases the probability USD/JPY will continue to decline inside this Falling Wedge.