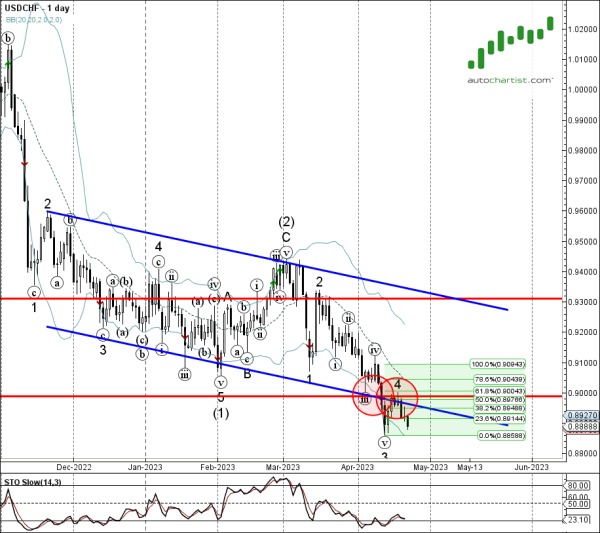
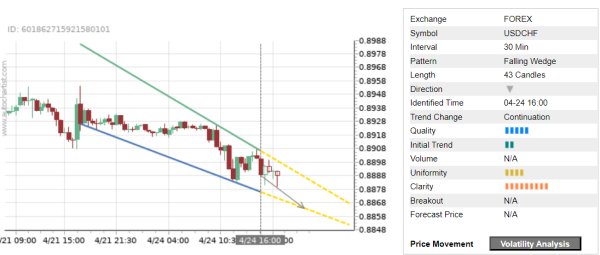
Trade of the Day: USD/CHF
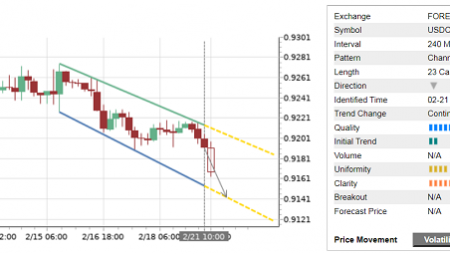
USD/CHF continues to fall inside the 30-minute Falling Wedge chart pattern, which was recently identified by Autochartist. Autochartist rates the quality of this Falling Wedge at the 5-bar level – which is the result of the slow Initial Trend (2 bars), below-average Uniformity (4 bars) and strong Clarity (8 bars). USD/CHF is expected to fall further inside this Falling Wedge.
As can be seen from the daily USD/CHF chart below – the pair earlier reversed down from the resistance zone located between the round resistance level 0.9000 (which reversed the pair earlier this month), 61.8% Fibonacci correction of the downward impulse from the start of April and the lower trendline of the daily down channel from January. The proximity of this resistance zone and the strong daily downtrend increase the probability USD/CHF will continue to fall further inside this Falling Wedge.