Trade of the Day: USD/CAD
By: Dima Chernovolov
USD/CAD continues to rise inside the 4-hour Rising Wedge chart pattern which was identified previously by Autochartist. Autochartist measures the quality of this Rising Wedge at the 5-bar level – which reflects the slow Initial Trend (2 bars), above-average Uniformity (6 bars) and strong Clarity (8 bars). USD/CAD is expected to rise further inside this Rising Wedge – in line with the earlier breakout of the key resistance area shown below.
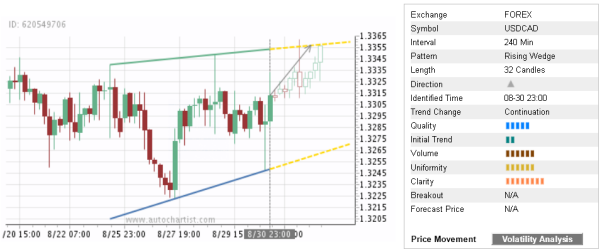
As can be seen from the daily USD/CAD chart below, the pair earlier broke though the resistance area lying between the resistance level 1.3335 (which reversed the price multiple times in August) and the 61.8% Fibonacci correction of the previous downward impulse from May. This price area is acting as strong support zone after it was broken. The proximity of this support area increases the probability USD/CAD will continue to rise inside this chart pattern.