Trade of the Day: NZD/USD
By: Dima Chernovolov
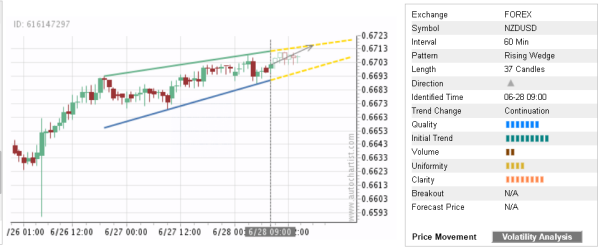
NZD/USD continues to rise inside the hourly Rising Wedge chart pattern which was earlier identified by Autochartist. Autochartist rates the quality of this Rising Wedge at the 7-bar level – which is the result of the strong Initial Trend (9 bars), below-average Uniformity (4 bars) and higher Clarity (8 bars). NZD/USD is expected to rise further inside Rising Wedge – in line with the earlier breakout of the key resistance area highlighted below.
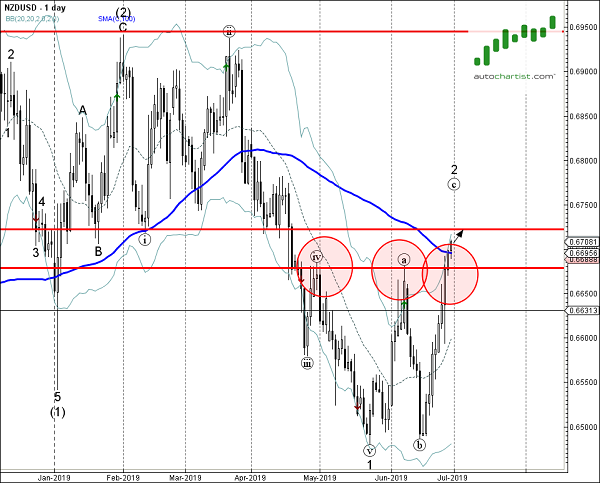
As can be seen from the daily NZD/USD chart below, the price earlier broke through the resistance area lying between the key resistance level 0.6680 (which has been reversing the price from April), and the 100-day moving average. The breakout of this resistance area accelerated the active short-term impulse wave (c). This price area is acting as support zone after it was broken. The proximity of this support area increases the probability NZD/USD will continue to rise toward the next resistance level 0.6720 (foprmer support from April).