Торговля дня: NZD / USD
От: Dima Chernovolov
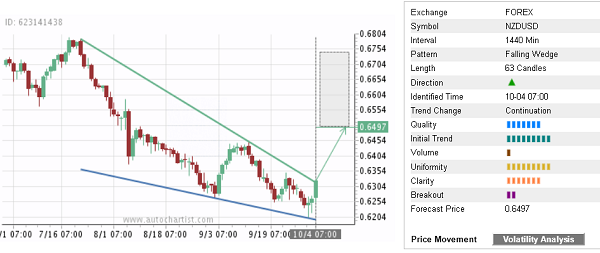
NZD/USD recently broke the daily Falling Wedge chart pattern which was identified recently by Autochartist. Autochartist оценивает качество этой Нисходящий клин на уровне 7-бар - который отражает резкий Начальный Тренд (9 брусья), высокая Однородность (9 брусья) и значительная Ясность (7 брусья). Ожидается рост NZD / USD в сторону прогнозируемой цены. 0.6497 - в соответствии с более ранним разворотом вверх от основной области поддержки, показанной ниже.
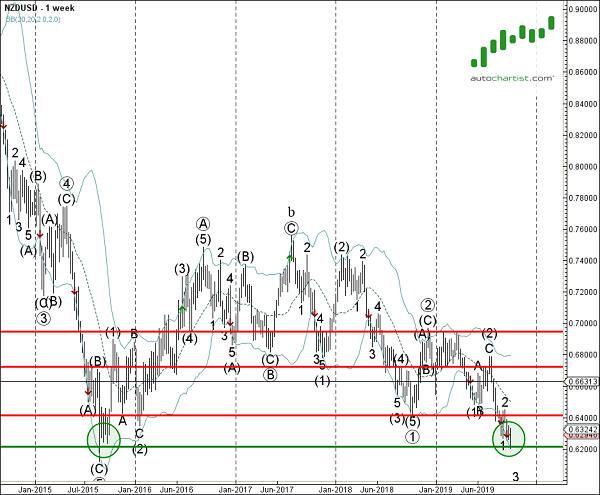
Как видно из еженедельного NZD / USD графики ниже, the bottom of this Falling Wedge formed when the price reversed up from the support area lying between the long-term support level 0.6200 (что остановило резкий недельный нисходящий тренд 2015) а нижняя полоса Боллинджера еженедельно. The proximity of this support area increases the probability NZD/USD will continue to rise toward the forecast price 0.6497.