Trade of the Day: NZD/USD
By: Dima Chernovolov
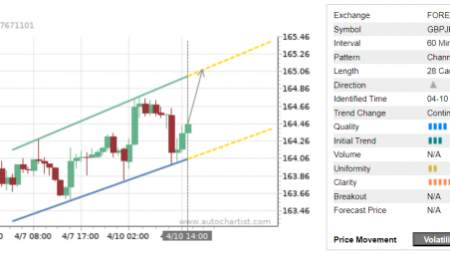
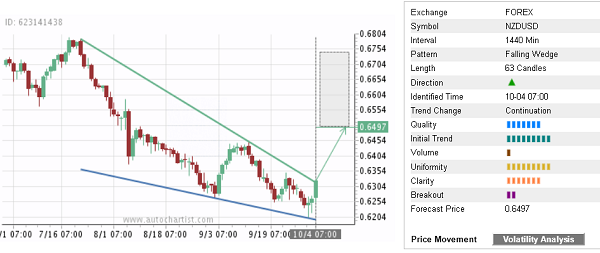
NZD/USD recently broke the daily Falling Wedge chart pattern which was identified recently by Autochartist. Autochartist rates the quality of this Falling Wedge at the 7-bar level – which reflects the sharp Initial Trend (9 bars), high Uniformity (9 bars) and significant Clarity (7 bars). NZD/USD is expected to rise toward the forecast price 0.6497 – in line with the earlier upward reversal from the major support area shown below.
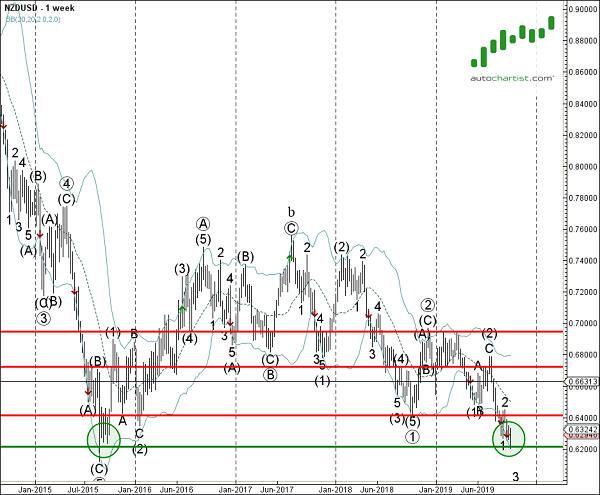
As can be seen from the weekly NZD/USD chart below, the bottom of this Falling Wedge formed when the price reversed up from the support area lying between the long-term support level 0.6200 (which stopped the sharp weekly downtrend in 2015) and the lower weekly Bollinger Band. The proximity of this support area increases the probability NZD/USD will continue to rise toward the forecast price 0.6497.