Trade of the Day: NZD/USD
By: Dima Chernovolov
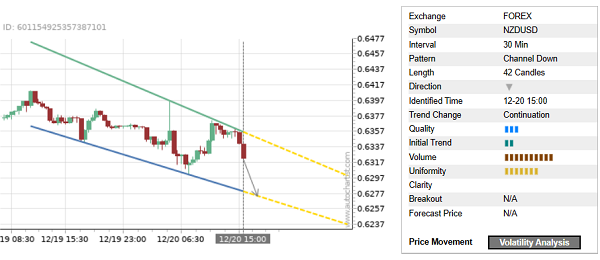
NZD/USD continues to fall inside the 30-minute Down Channel chart pattern, which was recently identified by Autochartist. Autochartist rates the quality of this Down Channel at the 3-bar level – which is the result of the slow Initial Trend (2 bars) and significant Uniformity (7 bars). NZD/USD is expected to fall further inside this Down Channel.
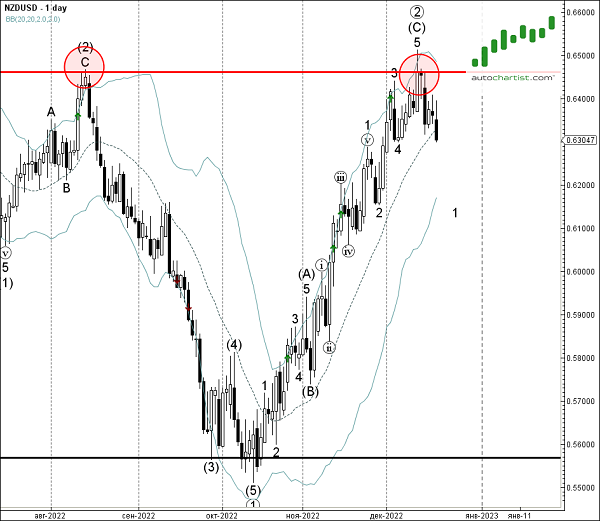
As can be seen from the daily NZD/USD chart below – the pair earlier reversed down from the key resistance area located between the long-term resistance level 0.64610 (which started the sharp downtrend in August) and the upper the daily Bollinger Band. The proximity of this resistance area increases the probability NZD/USD will continue to fall inside this Down Channel.