Торговля дня: NZD / USD
От: Dima Chernovolov
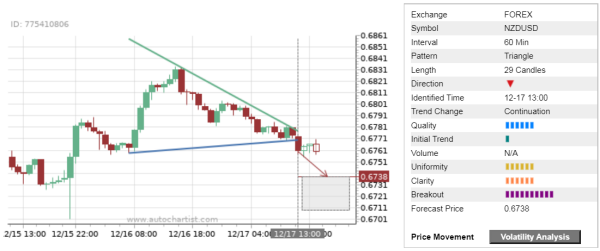
NZD/USD recently broke the hourly Triangle chart pattern, который был недавно идентифицирован Autochartist. Autochartist оценивает качество этого треугольника на уровне 6-бара - который является результатом медленного Начального Тренда (1 бар) и выше средняя Однородность и Ясность (6 брусья). Ожидается, что NZD / USD упадет до прогнозируемой цены 0.6738.

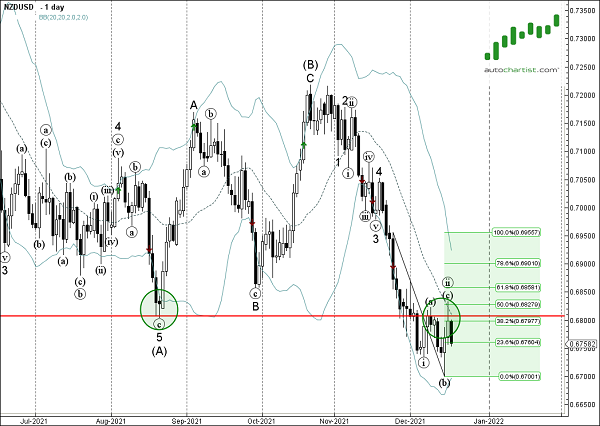
As can be seen from the daily NZD/USD chart below – the price earlier reversed down from the resistance zone lying between the key resistance level 0.6800 (former multi-month support from August) and the 20-day moving average. The proximity of this resistance area adds to the probability NZD/USD will continue to fall toward the forecast price 0.6738.


