Trade of the Day: NZD/USD
By: Dima Chernovolov
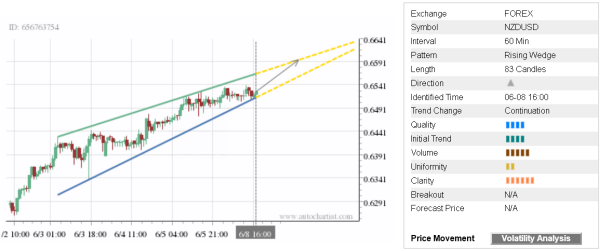
NZD/USD continues to rise inside the hourly Rising Wedge chart pattern which was previously identified by Autochartist. Autochartist rates the quality of this Rising Wedge at the 4-bar level – which reflects the below-average Initial Trend (4 bars), lower Uniformity (2 bars) and above-average Clarity (6 bars). NZD/USD is expected to rise further inside this chart pattern – in line with the earlier breakout of the resistance levels shown below.
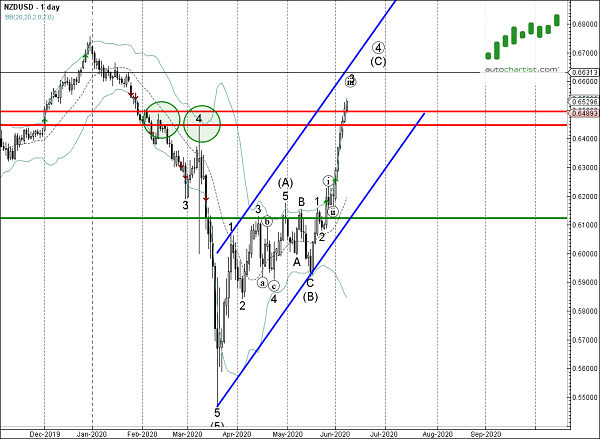
As can be seen from the daily NZD/USD chart below – the price earlier broke through the resistance area lying between the resistance levels 0.6450 (monthly high from March) and 0.6495(monthly high from February). This price area is acting as the strong support zone fatter it was broken. The proximity of this support area increases the probability NZD/USD will continue to rise inside this chart pattern.