Trade of the Day: NZD/JPY
By: Dima Chernovolov
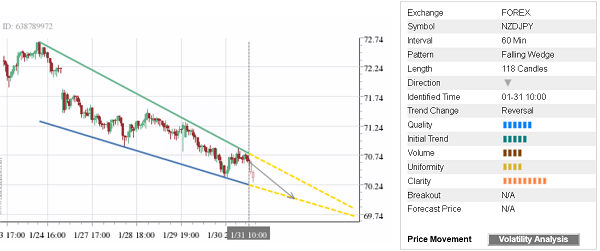
NZD/JPY continues to fall inside the hourly Falling Wedge chart pattern which was recently identified by Autochartist. Autochartist measures the quality of Falling Wedge at the 6-bar level – which is the result of the medium Initial Trend (5 bars), lower Uniformity (4 bars) and strong Clarity (8 bars). NZD/JPY is expected to fall further inside this chart pattern – in line with the earlier breakout of the support area highlighted below.
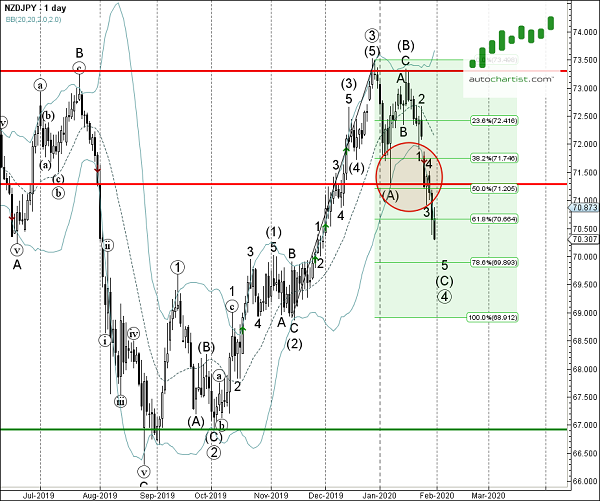
As can be seen from the daily NZD/JPY chart below – the price earlier broke through the support area lying between the support level 71.30 (low of the previous Hammer from the start of January) and the 50% Fibonacci retracement of the previous upward impulse from the middle of November. This price zone is acting as the resistance area after it was broken. The proximity of this resistance area increases the probability NZD/JPY will continue to fall inside this chart pattern.