Trade of the Day: NZD/JPY
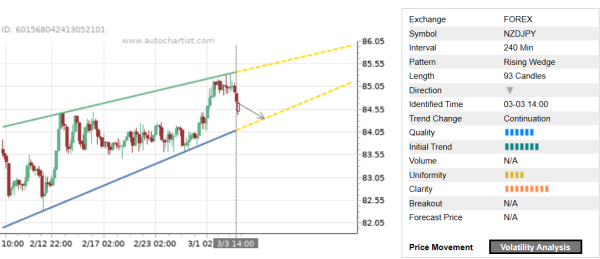
NZD/JPY continues to fall inside the 4-hour Rising Wedge chart pattern, which was recently identified by Autochartist. Autochartist rates the quality of this Rising Wedge at the 7-bar level – which is the result of the significant Initial Trend (7 bars), below-average Uniformity (4 bars) and near-maximum Clarity (9 bars). NZD/JPY is expected to fall further inside this Rising Wedge.
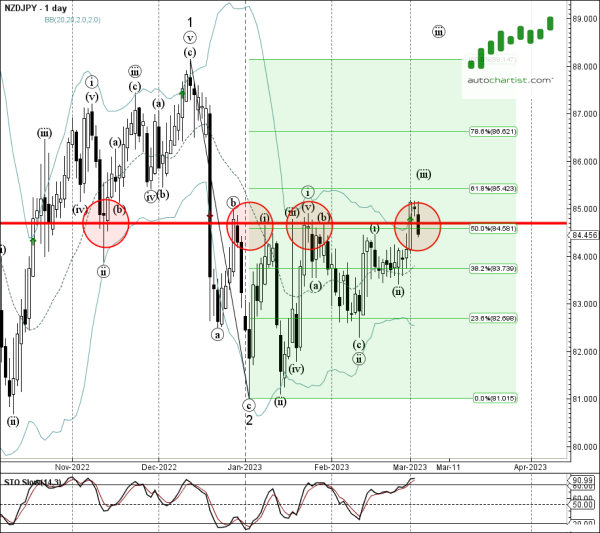
As can be seen from the daily NZD/JPY chart below – the price earlier reversed down from the resistance area located between the key resistance level 84.700 (which has been reversing the price from the end of December), upper daily Bollinger Band and the 50% Fibonacci correction of the sharp downward impulse from the start of December. The proximity of this resistance area and the overbought daily Stochastic increase the probability NZD/JPY will continue to fall further inside this Rising Wedge.