Trade of the Day: NZD/JPY
By: Dima Chernovolov
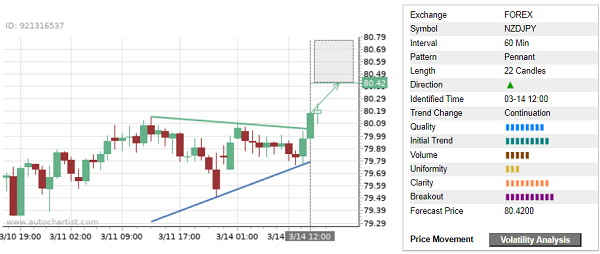
NZD/JPY recently broke the hourly Pennant chart pattern, which was previously identified by Autochartist. Autochartist rates the quality of this Pennant at the 8-bar level – which is the result of the sharp Initial Trend (9 bars), low Uniformity (3 bars) and strong Clarity (9 bars). NZD/JPY is expected to rise toward the forecast price 80.42.
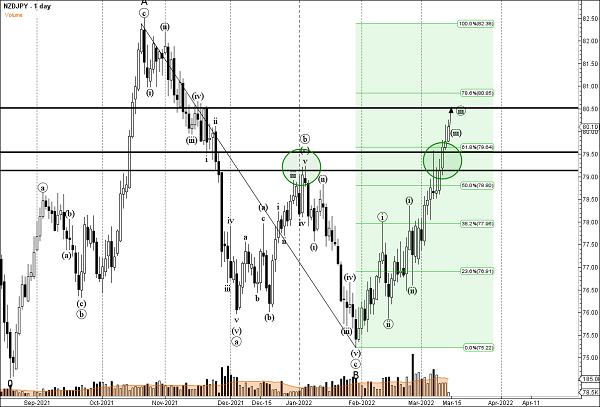
As can be seen from the daily NZD/JPY chart below – the pair earlier broke resistance area located between the key resistance levels 79.10 (monthly high from January), 79.50 and the 50% Fibonacci correction of the downward ABC correction B from October. This price area is acting as the support area after it was broken. The proximity of this support zone adds to the probability NZD/JPY will continue rise toward the forecast price 80.42.