Trade of the Day: NZD/JPY
By: Dima Chernovolov
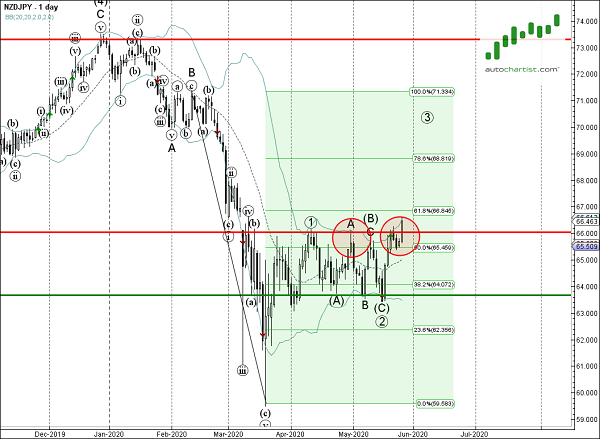
NZD/JPY continues to rise after the earlier breakout of the daily Triangle chart pattern which was previously identified by Autochartist. Autochartist rates the quality of this Triangle at the 5-bar level – which is the result of the below-average Initial Trend (4 bars), higher Uniformity (6 bars) and low Clarity (1 bar). NZD/JPY is expected to rise toward the forecast price 68,93.
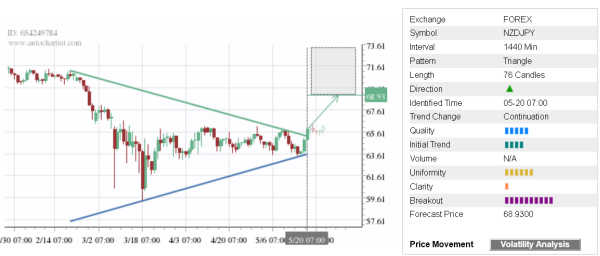
As can be seen from the daily NZD/JPY chart below – the breakout of this Triangle coincided with the breakout of the resistance area lying between the key resistance level 66,00 (which has been steadily reversing the price from April) and the 50% Fibonacci correction of the previous downward impulse from the start of February. This price zone is acting as the support area after it was broken. The proximity of this support zone adds to the probability NZD/JPY will continue to rise toward the forecast price 68,93.