Trade of the Day: NZD/JPY
By: Dima Chernovolov
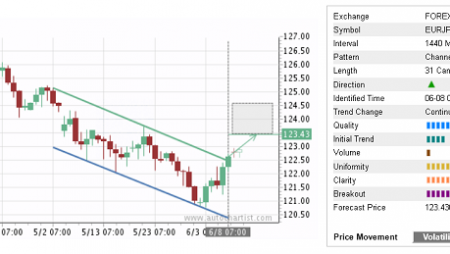
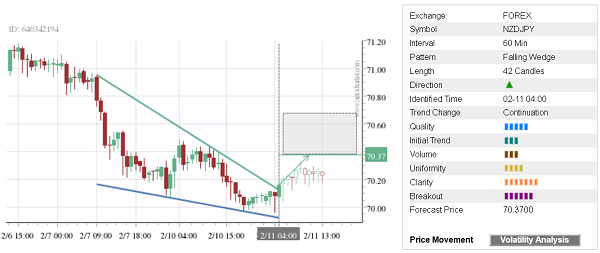
NZD/JPY recently broke the hourly Falling Wedge chart pattern which was recently identified by Autochartist. Autochartist rates the quality of this Falling Wedge at the 5-bar level – which is the result of the slow Initial Trend (3 bars), higher Uniformity (4 bars) and significant Clarity (7 bars). NZD/JPY expected to rise toward the forecast price 70,37 – in line with the earlier upward reversal from the support area shown below.
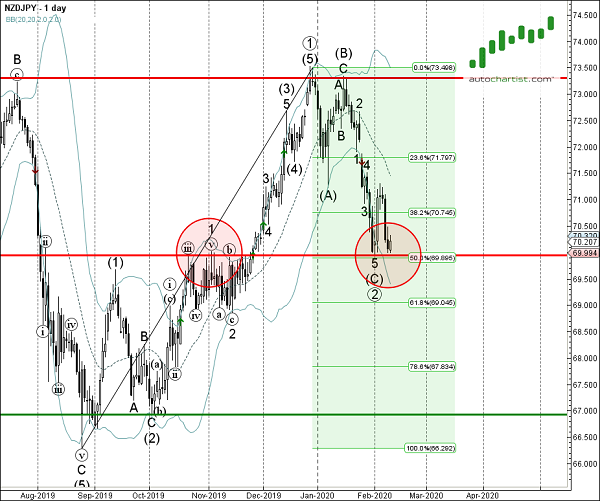
As can be seen from the daily NZD/JPY chart below – the bottom of this Falling Wedge formed when the price reversed up from the support area lying between the round support level 70,00 (former strong resistance from November), lower daily Bollinger Band and the 50% Fibonacci retracement of the previous sharp upward impulse from August. The proximity of this support area increases the probability NZD/JPY will continue to rise toward the forecast price 70,37.