Trade of the Day: NZD/CHF
By: Dima Chernovolov
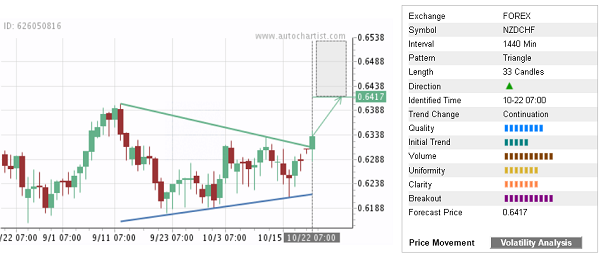
NZD/CHF recently broke the daily Triangle chart pattern which was identified previously by Autochartist. Autochartist rates the quality of this Triangle at the 9-bar level – which is the result of the medium Initial Trend (5 bars) and significant Uniformity and Clarity (7 bars). NZD/CHF is expected to rise toward the forecast price 0.6417.
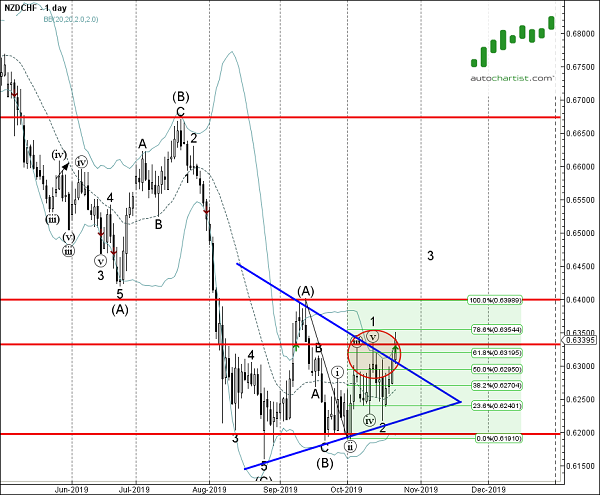
As can be seen from the daily NZD/CHF chart below, the breakout of this Triangle coincided with the breakout of the resistance area lying between the key resistance level 0.6330 (which has been reversing the price from the start of October) and the 61.8% Fibonacci retracement of the previous sharp downward impulse wave from September. This price area is acting as support zone after it was broken. The proximity of this support area increases the probability NZD/CHF will continue to rise toward the forecast price 0.6417.