Trade of the Day: NZD/CHF
By: Dima Chernovolov
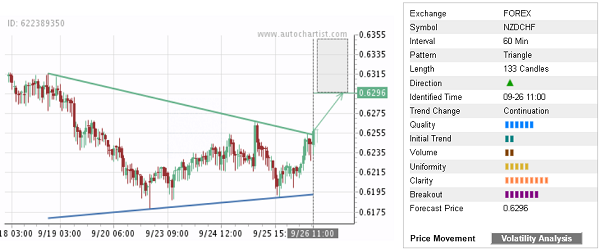
NZD/CHF recently broke the hourly Triangle chart pattern which was identified recently by Autochartist. Autochartist rates the quality of this Triangle at the 6-bar level – which reflects the slow Initial Trend (2 bars), average Uniformity (5 bars) and strong Clarity (8 bars). NZD/CHF is expected to rise toward the forecast price 0.6296 – in line with the earlier upward reversal from the support area shown below.
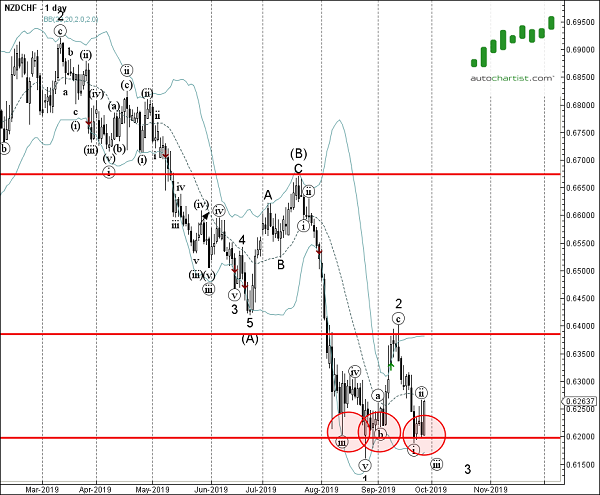
As can be seen from the daily NZD/CHF chart below, the pair earlier reversed up from the support area lying between the key support level 0.6200 (which reversed the price multiple times from August) and the lower daily Bollinger Band. The proximity of this support area increases the probability NZD/CHF will continues to rise toward the forecast price 0.6296.