Trade of the Day: NZD/CHF
By: Dima Chernovolov
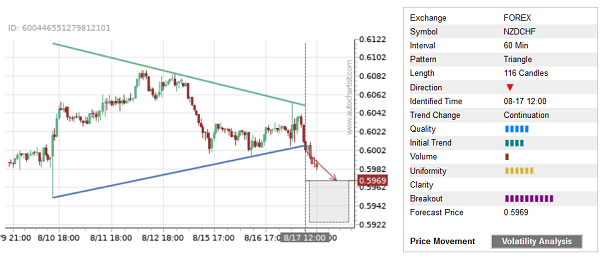
NZD/CHF recently broke the hourly Triangle chart pattern, which was previously identified by Autochartist. Autochartist measures the quality of this Triangle at the 5-bar level – which is the result of the below-average Initial Trend (4 bars) and higher Uniformity (6 bars). NZD/CHF is expected to fall toward the forecast price 0.5969.
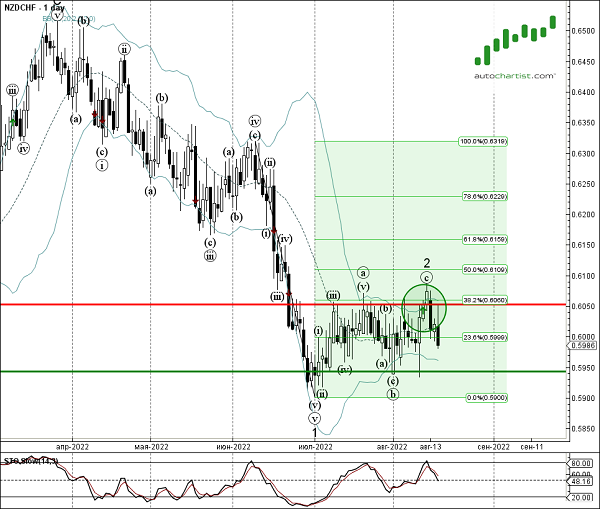
As can be seen from the daily NZD/CHF chart below – the pair earlier reversed down from the resistance area located between the strong resistance level 0.6050 (which has been reversing the pair from the end of June), 38.5% Fibonacci correction of the downward impulse from June and the upper daily Bollinger Band. The proximity of this resistance area and the clear daily downtrend add to the probability NZD/CHF will continue to fall toward the forecast price 0.5969.