Trade of the Day: NZD/CAD
By: Dima Chernovolov
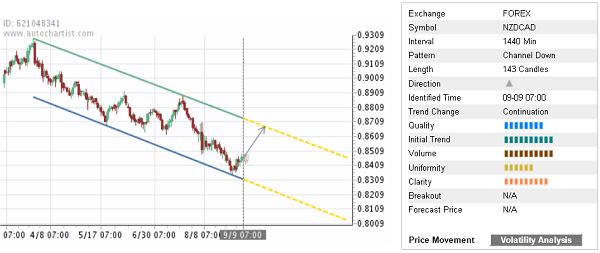
NZD/CAD continues to rise inside the daily Down Channel chart pattern which was identified previously by Autochartist. Autochartist rates the quality of this Down Channel at the 8-bar level – which reflects the sharp Initial Trend (10 bars), above-average Uniformity (6 bars) and strong Clarity (8 bars). NZD/CAD is expected to rise further inside this Down Channel – in line with the earlier upward reversal from the key support area shown below.
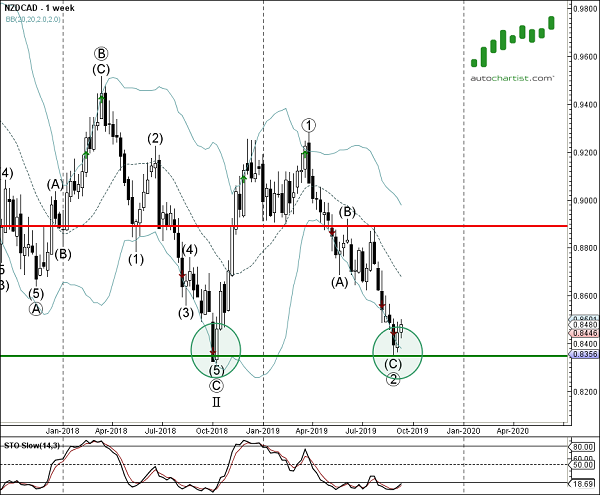
As can be seen from the weekly NZD/CAD chart below, the bottom of this Down Channel formed when the price reversed up from the support area lying between the long-term support level 0.8350 ( which stopped the sharp downtrend in 2018) and the lower weekly Bollinger Band. The proximity of this support area and the oversold weekly Stochastic increase the probability NZD/CAD will continue to rise inside this Down Channel.