Trade of the Day: NZD/CAD
By: Dima Chernovolov
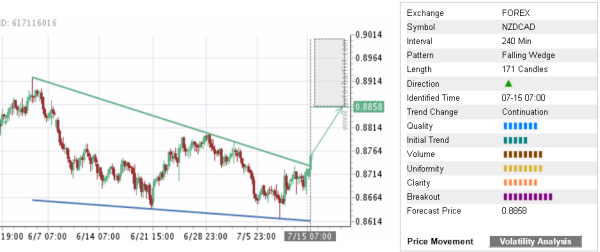
NZD/CAD recently broke the uniform 4-hour Falling Wedge chart pattern which was earlier identified by Autochartist. Autochartist rates the quality of this Falling Wedge at the 7-bar level – which is the result of the medium Initial Trend (5 bars), strong Uniformity (8 bars) and significant Clarity (7 bars). NZD/CAD is expected to rise toward the forecast price 0.8858 – in line with the earlier upward reversal from the key support area shown below.
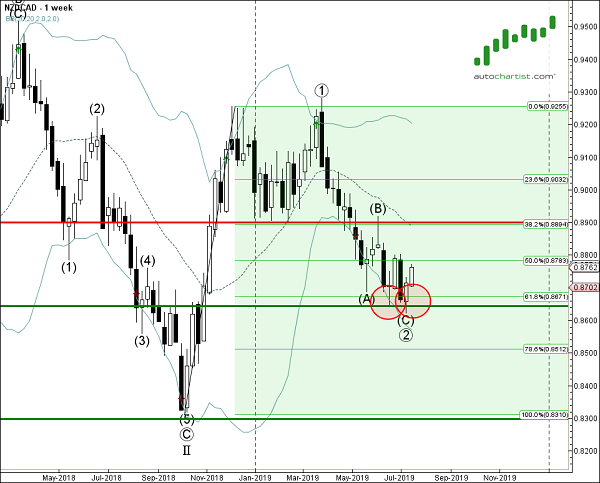
As can be seen from the weekly NZD/CAD chart below, the top of this Falling Wedge formed when the price reversed up sharply from the support area lying between the support level 0.8640, lower weekly Bollinger Band and the 61.8% Fibonacci corrector of the sharp upward impulse from last year. The proximity of this support area increases the probability NZD/CAD will continue to rise toward the forecast price 0.8858.