Trade of the Day: NZD/CAD
By: Dima Chernovolov
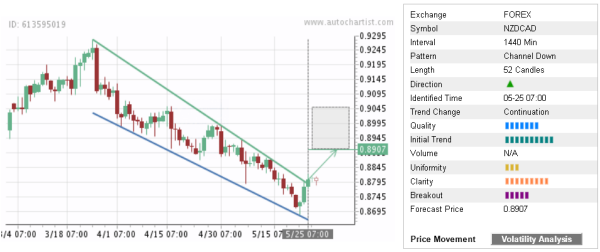
NZD/CAD recently broke the daily Down Channel chart pattern which was previously identified by Autochartist. Autochartist rates the quality of this Down Channel at the 7-bar level – which is the result of the sharp Initial Trend (10 bars), lower Uniformity (3 bars) and substantial Clarity (9 bars). NZD/CAD is expected to rise further toward the forecast price 0.8907 – in line with the earlier upward reversal from the key support level shown below.
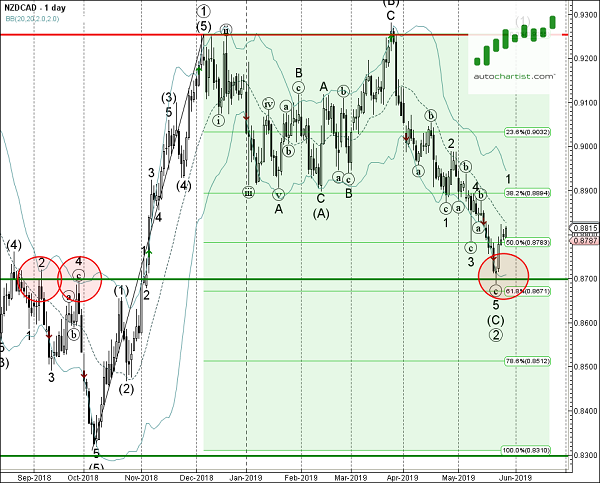
As can be seen from the daily NZD/CAD chart below, the price earlier reversed up with the daily Japanese candlesticks reversal pattern Morning Star from the support area lying between the key support level 0.8700 (former resistance from September of 2018), lower daily Bollinger Band and the 61.8% Fibonacci correction of the previous upward impulse from last October. The proximity of this support area increases the probability NZD/CAD will continue to rise toward the forecast price 0.8907.