Trade of the Day: NZD/CAD
By: Dima Chernovolov
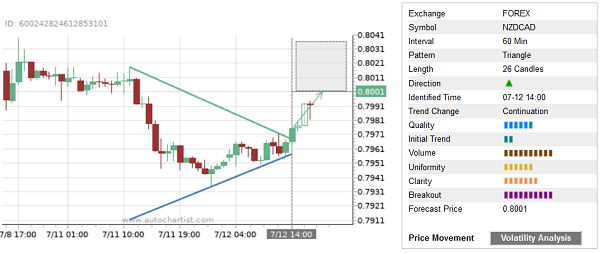
NZD/CAD recently broke the hourly Triangle chart pattern, which was recently identified by Autochartist. Autochartist rates the quality of this Triangle at the 6-bar level – which is the result of the slow Initial Trend (2 bars), above-average Uniformity (6 bars) and higher Clarity (7 bars). NZD/CAD is expected to rise toward the forecast price 0.8001.
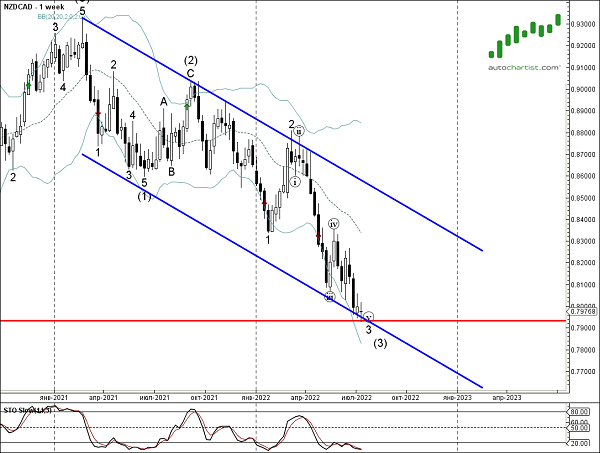
As can be seen from the weekly NZD/CAD chart below – the price earlier reversed up from the support area located between the major support level 0.7945 (former yearly low from 2012), lower weekly Bollinger Band and the support trendline of the weekly down channel from the start of last year. The proximity of this support area and the oversold weekly Stochastic add to the probability NZD/CAD will continue to rise toward the forecast price 0.8001.