Trade of the Day: NZD/CAD
By: Dima Chernovolov
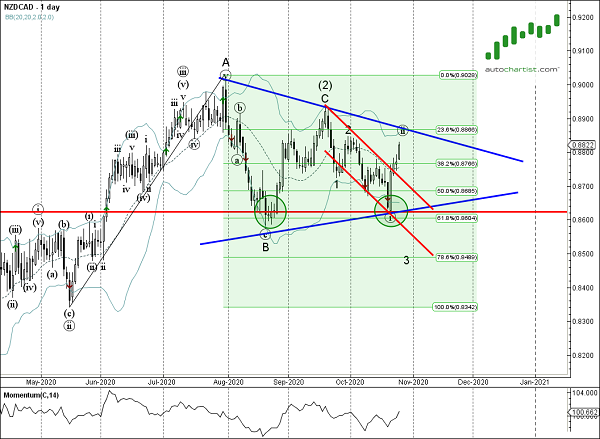
NZD/CAD continues to rise inside the daily Triangle chart pattern, which was previously identified by Autochartist. Autochartist rates the quality of this Triangle at the 7-bar level – which is the result of the significant Initial Trend (8 bars), average Uniformity (5 bars) and higher Clarity (6 bars). NZD/CAD is expected to rise further inside this Triangle in line with the earlier upward reversal form the support area shown below.
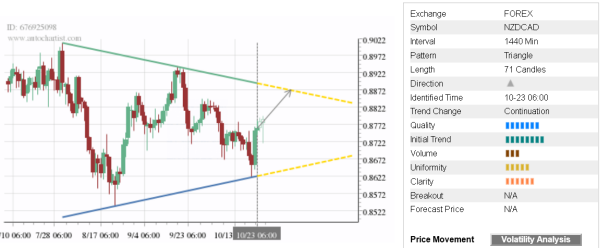
As can be seen from the daily NZD/CAD chart below, the price earlier reversed up from the support area located between the key support level 0.8625 (which also stopped the price in August), lower daily Bollinger band and the 61.8% Fibonacci correction of the upward impulse from May. The proximity of this support area adds to the probability NZD/CAD will continue to rise inside this Triangle.