Trade of the Day: NZD/CAD
By: Dima Chernovolov
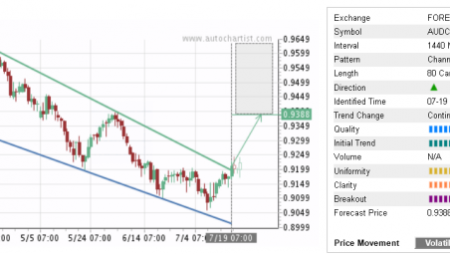
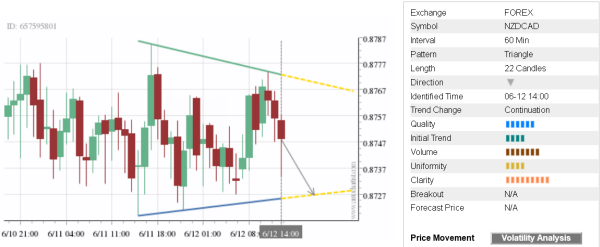
NZD/CAD continues to fall inside the hourly Triangle chart pattern which was previously identified by Autochartist. Autochartist rates the quality of this Triangle at the 6-bar level – which reflects the slow Initial Trend (4 bars), below average Uniformity (4 bars) and near-maximum Clarity (9 bars). NZD/CAD is expected to fall further inside this Triangle – in line with the earlier downward reversal from the key resistance area shown below.
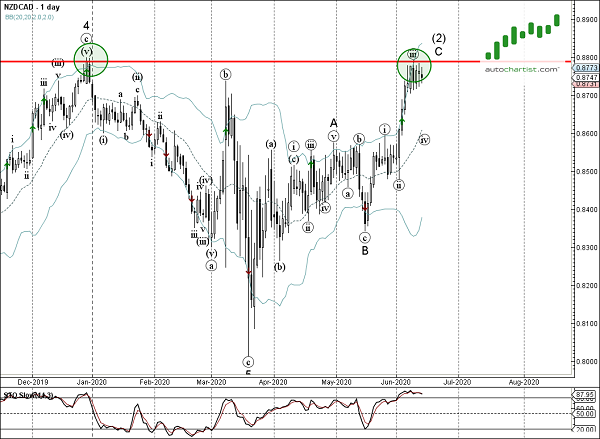
As can be seen from the daily NZD/CAD chart below – the price earlier reversed down from the strong resistance area lying between the multi-month resistance level 0.8790 (which stopped the sharp uptrend in December of 2019) and the upper daily Bollinger Band. The proximity of this resistance area and the overbought daily Stochastic add to the likelihood NZD/CAD will continue to fall inside this Triangle.