Торговля дня: GBP / USD
От: Dima Chernovolov
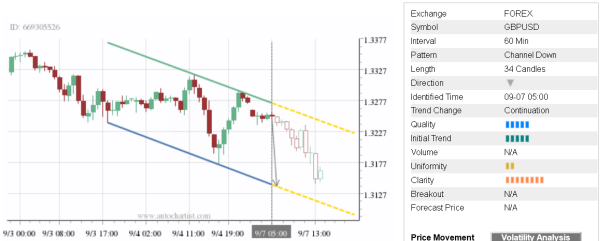
GBP/USD continues to fall inside the hourly Down Channel chart pattern which was recently identified by Autochartist. Autochartist оценивает качество этого нисходящего канала на уровне 5 столбцов, что является результатом среднего начального тренда. (5 брусья), низкая Однородность (2 брусья) и значительная Ясность (7 брусья). GBP/USD expected to fall further inside this Down Channel – in line with the earlier downward reversal from the resistance area shown below.
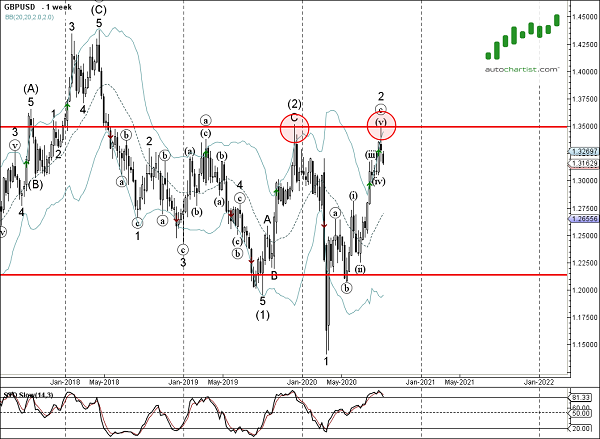
As can be seen from the weekly GBP/USD chart below – price earlier reversed down from the resistance area lying between the long-term resistance level 1,3500 (former powerful resistance from the end of 2019) и верхняя полоса Боллинджера еженедельно. The proximity to this resistance area and the overbought weekly Stochastic increase the probability GBP/USD will continue to fall inside this Down Channel.