Trade of the Day: GBP/USD
By: Dima Chernovolov
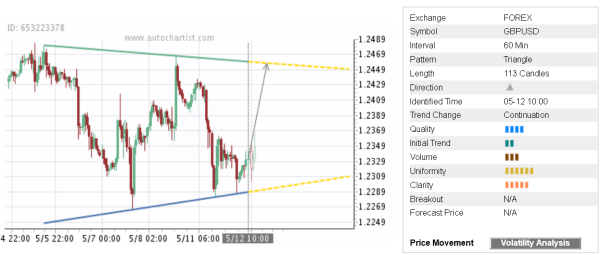
GBP/USD continues to rise inside the hourly Triangle chart pattern which was recently identified by Autochartist. Autochartist measures the quality of this Triangle at the 4-bar level – which is the result of the slow Initial Trend (2 bars), above-average Uniformity (6 bars) and medium Clarity (5 bars). GBP/USD is expected to rise further inside this Triangle – in line with the earlier upward reversal from the strong support zone shown below.
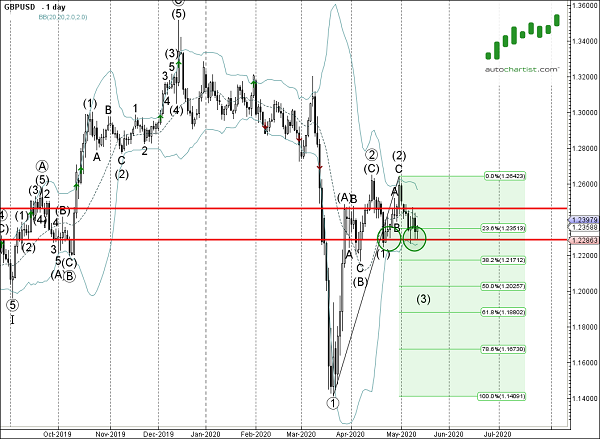
As can be seen from the daily GBP/USD chart below – the bottom of this Triangle formed near the support zone lying between the support level 1.2285 (which also reversed the price at the start of May and in the middle of April) and the lower daily Bollinger Band. The proximity of this support zone increases the probability GBP/USD will continue to rise inside this Triangle.