Trade of the Day: GBP/USD
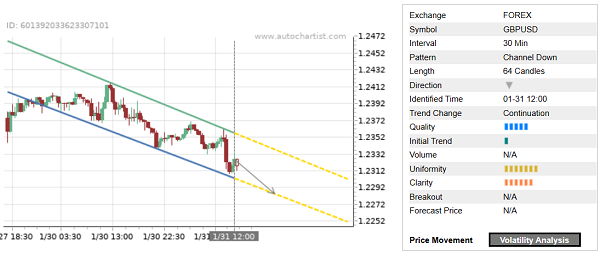
GBP/USD continues to fall inside the 30-minute Down Channel chart pattern, which was recently identified by Autochartist. Autochartist rates the quality of this Down Channel at the 5-bar level – which is the result of the slow Initial Trend (1 bar), stronger Uniformity (7 bars) and above-average Clarity (6 bars). GBP/USD is expected to fall further inside this Down Channel.
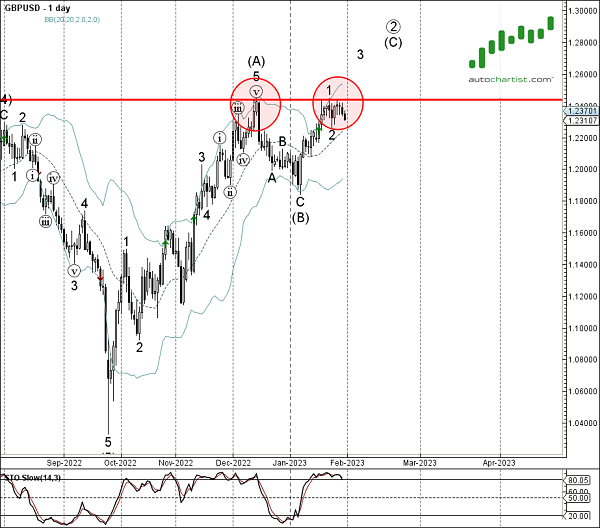
As can be seen from the daily GBP/USD chart below – the pair earlier reversed down the resistance area located between the pivotal resistance level 1.2440 (previous monthly high from December) and the upper daily Bollinger Band. The proximity of this resistance area and the overbought daily Stochastic increase the probability GBP/USD will continue to fall inside this Down Channel.