Trade of the Day: GBP/USD
By: Dima Chernovolov
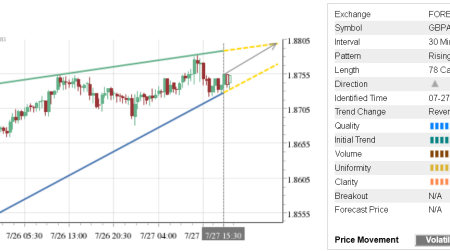
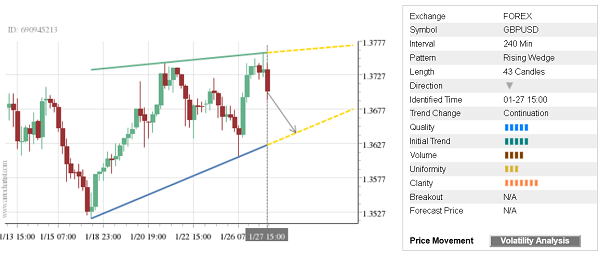
GBP/USD continues to fall inside the 4-hour Rising Wedge chart pattern, which was previously identified by Autochartist. Autochartist rates the quality of Rising Wedge at the 5-bar level – which is the result of the medium Initial Trend (5 bar), lower Uniformity (3 bars) and above-average Clarity (6 bars). GBP/USD is expected to fall further inside this Rising Wedge.
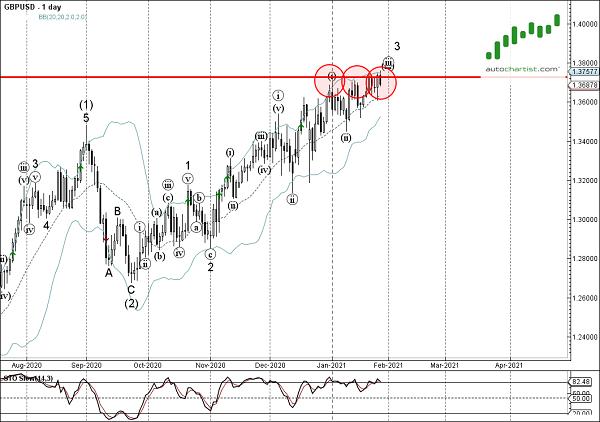
As can be seen from the daily GBP/USD chart below, the top of this Rising Wedge formed when the pair reversed down from the resistance area lying between the key resistance level 1.3725 (which has been reversing the price from the end of December) and the upper daily Bollinger Bad. The proximity of this resistance area and the overbought daily Stochastic increase the probability GBP/USD will continue to fall inside this Rising Wedge.