Trade of the Day: GBP/NZD
By: Dima Chernovolov
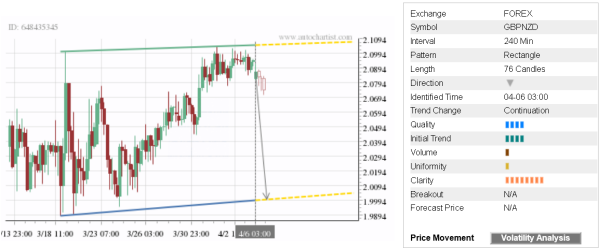
GBP/NZD continues to fall inside the 4-hour Rectangle chart pattern which was previously identified by Autochartist. Autochartist rates the quality of this Rectangle at the 4-bar level – which is the result of the below-average Initial Trend (4 bars), small Uniformity (1 bar), and significant Clarity (7 bars). GBP/NZD is expected to fall further inside this Rectangle – in line with the earlier downward reversal from the key resistance area shown below.
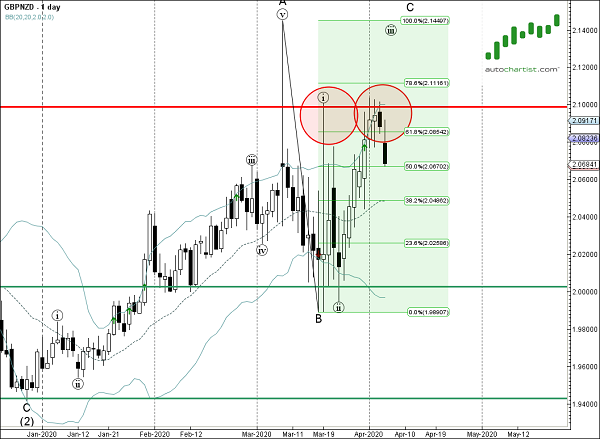
As can be seen from the daily GBP/NZD chart below – both of the upper pivots of this Rectangle formed when the pair reversed down from the resistance area lying between the key resistance level 2.100, upper daily Bollinger Band and the 61.8% Fibonacci retracement of the previous downward impulse from the start of March. The proximity of this resistance zone adds to the probability GBP/NZD will continue to fall inside this Rectangle.