Trade of the Day: GBP/CAD
By: Dima Chernovolov
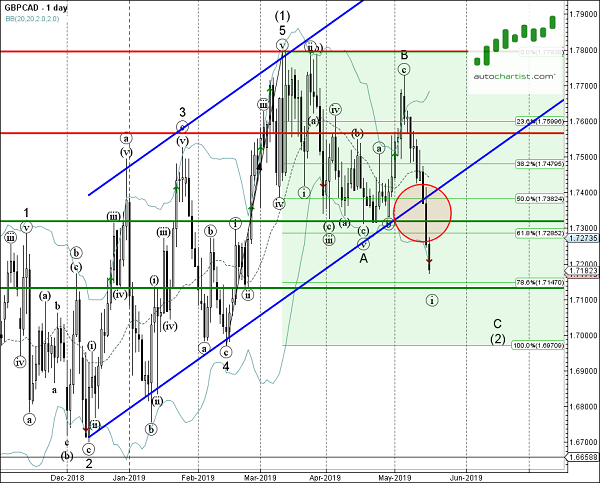
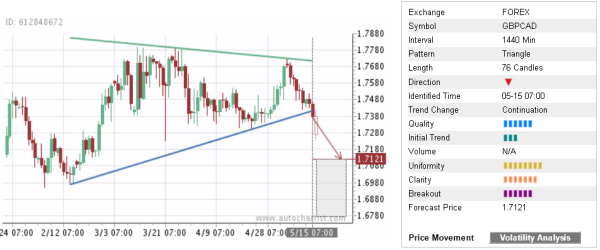
GBP/CAD continues to fall after the recent breakout of the daily Triangle chart pattern which was recently identified by Autochartist. Autochartist rates the quality of this Triangle at the 6-bar level – which is the result of the lower Initial Trend (8 bar), significant Uniformity (8 bars) and strong Clarity (7 bars). GBP/CAD is expected to fall toward the forecast price 1.7121 – in line with the earlier breakout of the support area shown below.
As can be seen from the daily GBP/CAD below, the price recently broke the support area lying between the key support level 1.7300 (which reversed the price multiple times in April), support trendline of the daily up channel from December and the 61.8% Fibonacci correction of the previous upward impulse from February. This price area is acting as resistance zone after it was broken. The proximity of this resistance zone increases the probability P/CAD will continue to fall toward the forecast price 1.7121.