Trade of the Day: EUR/NZD
By: Dima Chernovolov
EUR/NZD continues to fall inside the 30-minute Falling Wedge chart pattern which was identified previously by Autochartist. Autochartist measures the quality of this Falling Wedge at the 4-bar level – which reflects the slow Initial Trend (1 bar), above-average Uniformity (6 bars) and significant Clarity (7 bars). EUR/NZD is expected to fall further inside this chart pattern – in line with the earlier downward reversal from the key resistance area shown below.
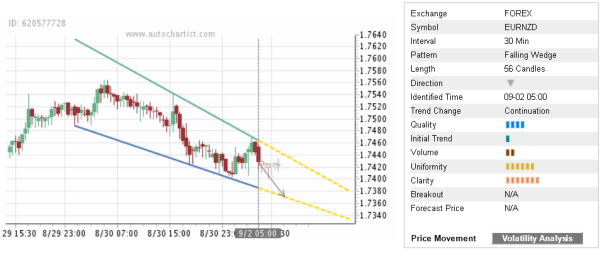
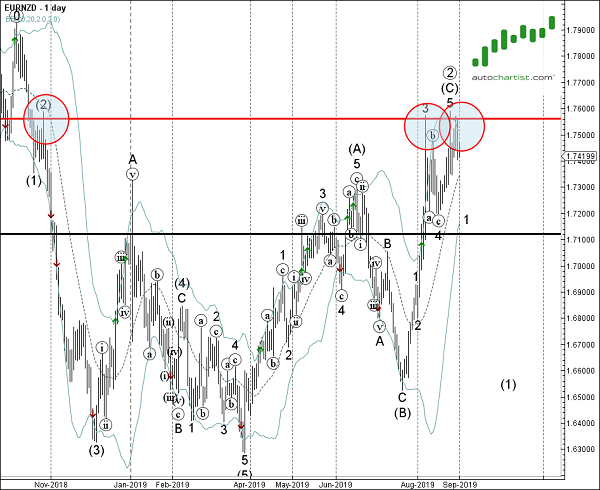
As can be seen from the daily EUR/NZD chart below, the top of this Falling Wedge formed when the price reversed down from the resistance area lying between the resistance level 1.7560 and the upper daily Bollinger Band. The proximity of this resistance area increases the probability EUR/NZD will continue to fall inside this Falling Wedge.