Trade of the Day: EUR/CAD
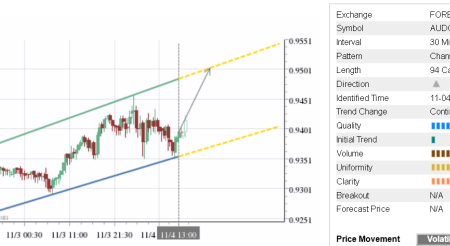
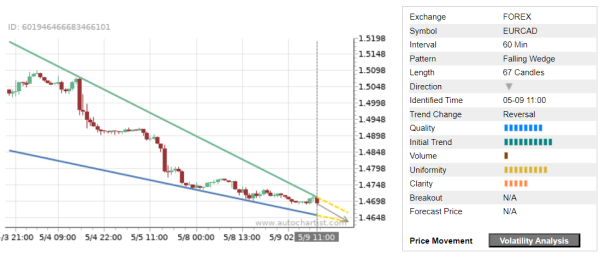
EUR/CAD continues to fall inside the hourly Falling Wedge chart pattern, which was recently identified by Autochartist. Autochartist measures the quality of this Falling Wedge at the 8-bar level – which is the result of the sharp Initial Trend (10 bars), strong Uniformity (8 bars) and average Clarity (5 bars). EUR/CAD is expected to fall further inside this Falling Wedge.
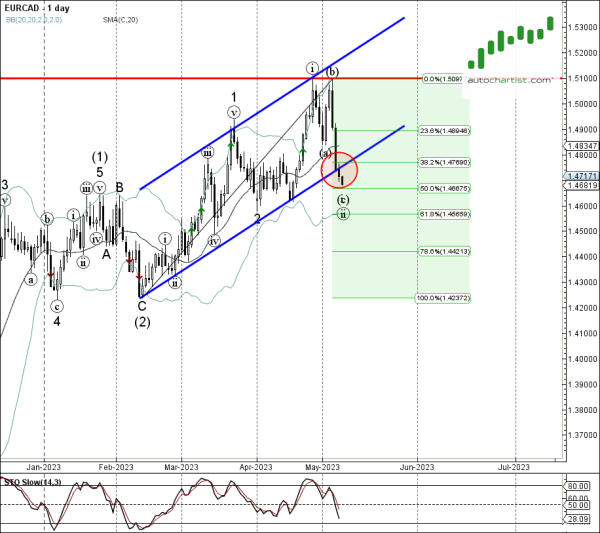
As can be seen from the daily EUR/CAD chart below – the pair earlier broke the support zone located between the support trendline of the daily up channel from February and the 38.2% Fibonacci correction of the upward impulse from February. This price zone is acting as the resistance area after it was broken. The proximity of this resistance area adds to the probability EUR/CAD will continue to fall inside this Falling Wedge.