Trade of the Day: EUR/CAD
By: Dima Chernovolov
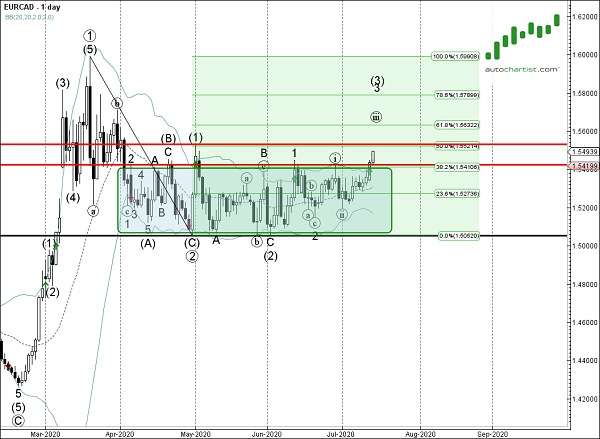
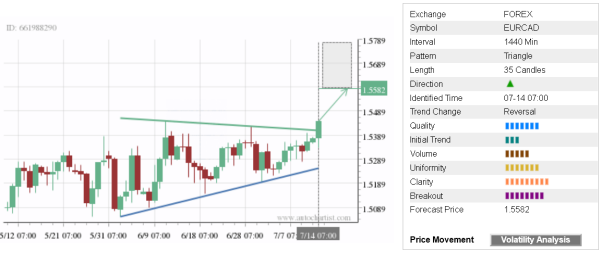
EUR/CAD recently broke the daily Triangle chart pattern which was previously identified by Autochartist. Autochartist rates the quality of this Triangle at the 7-bar level – which reflects the slow Initial Trend (3 bars), above-average Uniformity (7 bars) and strong Clarity (9 bars). EUR/CAD is expected to rise toward the forecast price 1,5582.
As can be seen from the daily EUR/CAD chart below – the breakout of this Triangle coincided with the breakout of the resistance area lying between the resistance level 1.5425 (upper boundary of the extended sideways price range inside which the pair has been trading from April) and the 38,2% Fibonacci correction of the downward correction from March. This price area is acting as the support zone after it was broken. The proximity of this support area adds to the probability EUR/CAD will continue to rise toward the forecast price 1,5582.