Trade of the Day: EUR/AUD
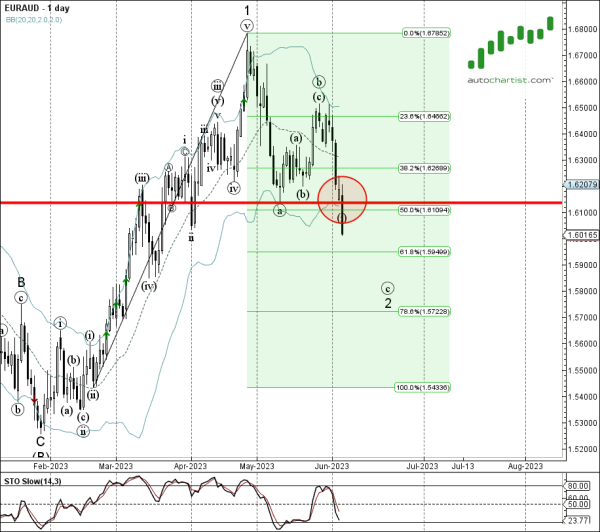
EUR/AUD continues to fall inside the daily Falling Wedge chart pattern, which was recently identified by Autochartist. Autochartist rates the quality of this Falling Wedge at the 5-bar level – which is the result of the slow Initial Trend (1 bars), average Uniformity (5 bars) and near-maximum Clarity (9 bars). EUR/AUD is expected to fall further inside this chart pattern.
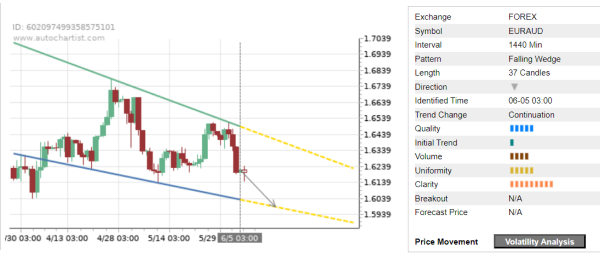
As can be seen from the daily EUR/AUD chart below – the pair earlier broke the support zone located between the support level 1.61360 (previous monthly low from May), coinciding with the 50% Fibonacci correction of the sharp daily uptrend from February. Both of these levels are acting as the resistance after they were broken. The proximity of these resistance levels increases the probability EUR/AUD will continue to fall inside this Falling Wedge.