Trade of the Day: AUD/USD
By: Dima Chernovolov
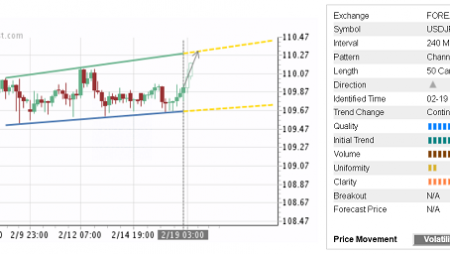
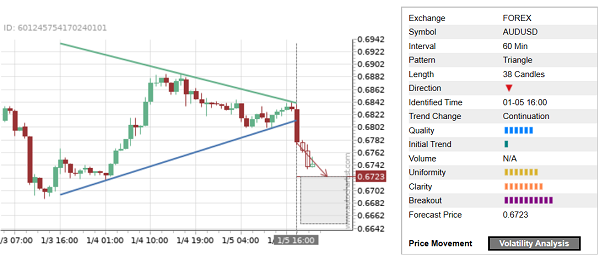
AUD/USD recently broke the hourly Triangle chart pattern, which was previously identified by Autochartist. Autochartist measures the quality of this Triangle at the 6-bar level – which is the result of the slow Initial Trend (1 bar), significant Uniformity (7 bars) and strong Clarity (8 bars). AUD/USD is expected to fall toward the forecast price 0.6723.
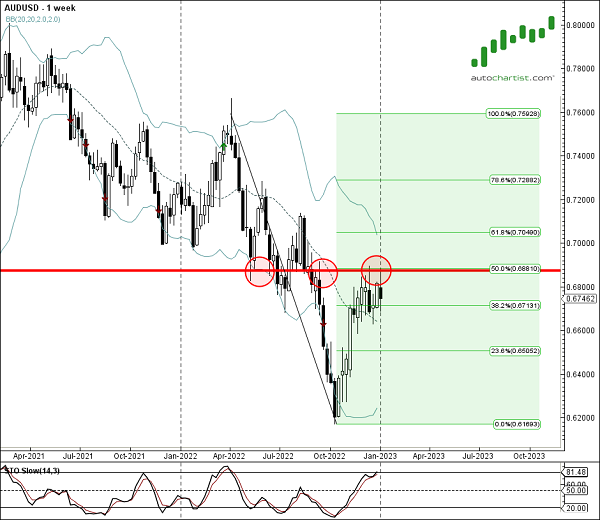
As can be seen from the weekly AUD/USD chart below – the pair earlier reversed down strongly from the resistance area located between the major resistance level 0.6875 (former strong support from the first half of 2022, acting as resistance from last September) and the 50% Fibonacci correction of the sharp downward impulse from the start of 2022. The proximity of this resistance area, overbought weekly Stochastic and the strong weekly downtrend increase the probability AUD/USD will continue to fall toward the forecast price 0.6723.